
In the latest GA release of Purity, version 4.1.5, there have been some nice improvements in how we handle host connectivity/balance reporting. There is a new CLI command to monitor the balance of I/O from a host standpoint as well as how we report/display host connectivity in the FlashArray web GUI. Let’s take a look at these enhancements. In Part 1, I will talk about the CLI enhancement.
The CLI Command…
The first thing I want to look at is the CLI command to monitor IO Balance. For awhile now, we have had an internal tool to look at I/O balance for all of the hosts connected to the FlashArray. This was typically run prior to a software upgrade, to make sure that hosts were connected to both controllers. When customers would see this tool, they would often ask, “Why can’t I use this?”
Good question.
Besides making sure there is connectivity redundancy, this is useful as as way to make sure things like host MPIO is also configured properly (like Round Robin instead of Fixed Path in VMware NMP). So in Purity 4.1.5 we added this to the standard CLI that all customers can use. The command is:
purehost monitor –balance
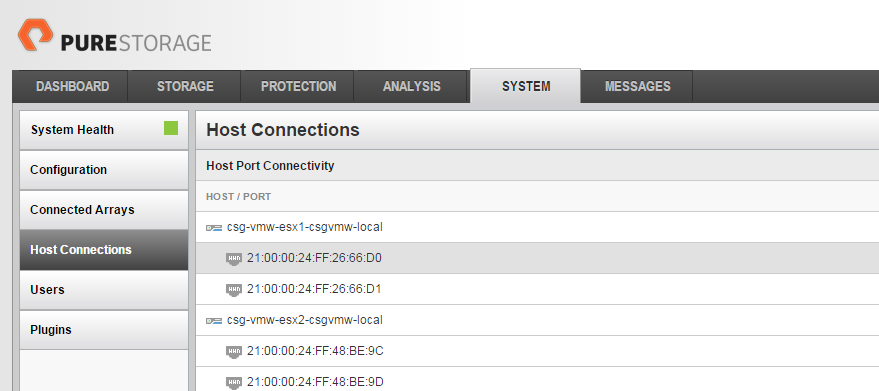
The command will report a few things:
- The host name
- The individual initiators from the host. If they are logged into more than one FlashArray port, it will be reported more than once. If an initiator is not logged in at all, it will not appear
- The port that initiator is logged into
- The number of I/Os that came into that port from that initiator over the time period sampled
- The relative percentage of I/Os for that initiator as compared to the maximum
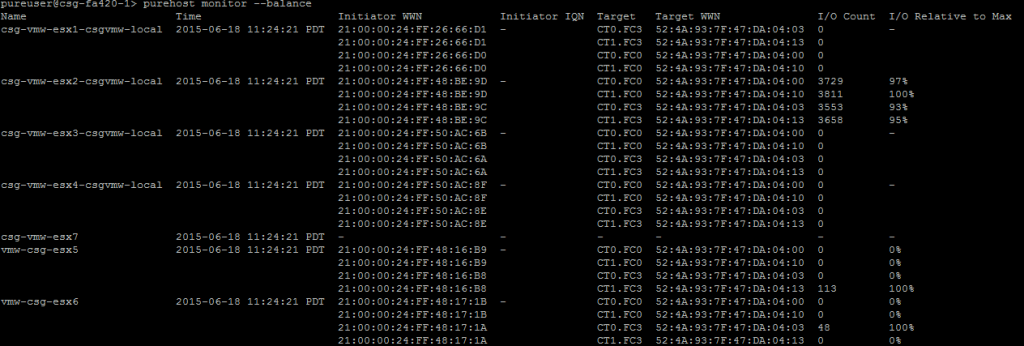 The first four are pretty straight forward,but was does number 5 mean? The balance command will count the I/Os that came down the particular initiator during the sampled time period, and it will do that for all initiator/target relationships for that host. Which ever relationship/path has the most I/Os will be designated as 100%. The rest of the paths will be then denoted as a percentage of that number. So if the a host has two paths, and the first one has 1000 I/Os and the second has 800, the first path will be 100% and the second will be 80%. Make sense?
A well balanced host should be within a few percentage points of each path. Anything more than 15% or so might be worthy of investigation.
The next question is the sample period. By default the command will make a sample period last five seconds. This can be altered by adding the –interval parameter and then applying a higher number in seconds (I wouldn’t recommend any lower than 5).
purehost monitor –balance –interval 20
If you want to keep it polling while you make changes, you can add the –repeat parameter followed by an integer to indicate how many samples you would like it to take before it ends.
purehost monitor –balance –repeat 20
You can combine both –interval and –repeat if you want. If –interval is omitted, it will be a 5 second sample. If –repeat is omitted, it will only run once.
Furthermore, you can specify to have it focus on just one host, or a set of hosts by supplying the host name (or names if you want more than one) in the command. When run without a host specified, it will report on all of your hosts.
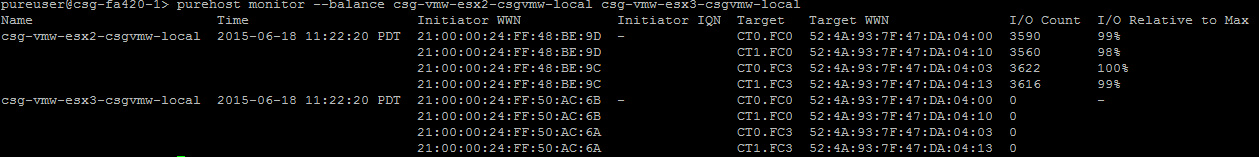
One host:
purehost monitor –balance csg-vmw-esx2-csgvmw-local
![]()
Two hosts:
purehost monitor –balance csg-vmw-esx2-csgvmw-local csg-vmw-esx3-csgvmw-local
Interpreting the results…
Okay that’s how to run the command, so now how to use it. A good host should look like what the above two screenshots do. 100% 99% 98% etc. But what about a bad host?
I set up a quick environment. One host, two datastores and a virtual machine on each datastore running a VDBench workload. The above screenshots show the host (host3) with Round Robin configured for both volumes, so the balance looks great. Below I “accidentally” set one of those two datastores to Fixed Path instead of Round Robin. So one datastore is good (using all 4 paths) and the other one is not (using only 1).
![]()
As you can see, one path is being hit hard with ~10,000 I/Os and the others are much less than that, around 20%. This is because one workload is only using one path and the other is using all four. Seeing an imbalance like this most likely means that some device (or devices) on that host is probably improperly configured with a Path Selection Policy (PSP) of either Fixed or Most Recently Used.
The below screenshot shows a different imbalance:
![]()
Only two of the four paths are being used (well one had a few). In this case, I set the PSP to Fixed for all of the devices. But imbalance like this could also mean an HBA is bad, or a switch. So this is likely a more systemic issue than a misconfiguration of a subset of devices. Or maybe someone added a WWN listing in the host object on the FlashArray incorrectly–either a wrong one, or a typo. Remember though, if the initiator is not logged in, it will not list it in this CLI command.
Next steps…
Let me mention–this is just the START of this. We have a lot planned for this functionality and of course the entire idea of being able to detect issues on the host from information we can get on the FlashArray–not just I/O imbalance. So definitely pay attention to this space. Specifically, look for REST API support, GUI integration (we have actually made a few related changes already), application plugin integration, automated alerts etc. There is a lot of cool stuff we can do with this, and we absolutely intend to.
Look for the Part II post in a day or so on the GUI enhancements that we have already implemented.
Great info have had to fix this on my clusters.
Thanks! Glad it was useful!
Awesome post, is this capability currently exposed via REST?
Thanks
Julian
Thanks! Unfortunately the balance checker is not in it yet as far as I know. Let me ask and see what the plans are for this.