
Yesterday, I wrote a post introducing the new latency-based round robin multipathing policy in ESXi 6.7 Update 1. You can check that out here:
Latency Round Robin PSP in ESXi 6.7 Update 1
In normal scenarios, you may not see much of a performance difference between the standard IOPS switching-based policy and the latency one. So don’t necessarily expect that switching policies will change anything. But then again, multipathing primarily exists not for healthy states, but instead exists to protect during times of poor health.
In the case of the latency policy, it works to route I/Os for a given device to the paths that exhibit the best performance (which is weighted for I/O size). Paths that are exhibiting higher latency are excluded until the next sampling period proves otherwise.
High latency of course doesn’t necessarily mean a problem though–it could simply mean the end result of the speed of light–the I/O has to travel some distance. For most SANs this number is almost inconsequential, but in the case of active/active replication–this comes into play.
Let’s take the following example. I have a host connected to two arrays. That host is accessing a volume that is protected by active-active replication by the two arrays. In other words, that volume exists on both arrays and can be written to and read from at the same time from either array. The host is in the same datacenter as one of the arrays, so the distance is small and the latency between that host and that array is only .05 ms one way.
The second array is in a different datacenter than the host and the other array. So the distance is greater between the remote array and the host, and therefore the latency between them is also higher–1 ms one way.
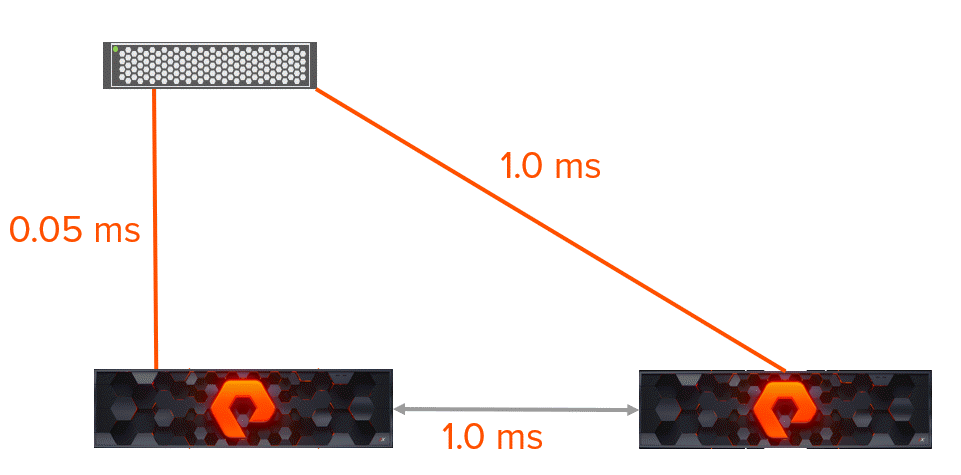
This host can write to either array for its storage. But the paths to the local array are a better option than the paths to the remote array. Why? Well because in active-active replication (also standard synchronous for that matter) writes have to be acknowledged on both of the arrays before the host can be told the data is committed–this is what allows both arrays to serve the data at once.
Because of the geographic disparity, not all paths are equal. Depending on which array the host writes to the latency can differ greatly. Let’s first take the case that the host writes to the local array:
- Host sends a write buffer request to local array. COST: .05 ms.
- The array opens the buffer request and responds back to the host. COST: .05 ms
- The host sends the write to the array. COST: .05 ms
- The array forwards the write to the remote array. COST: 1 ms.
- The remote array stores and acknowledges the write back to the local array. COST: 1 ms.
- The local array acknowledges back to the host that the write is complete. COST: .05 ms
.05 + .05 + .05 + 1 + 1 + .05 = 2.2 ms.
This is called an optimized write.
If the host though, instead decides to use a path to the remote array, the total time will be much longer.
- Host sends a write buffer request to remote array. COST: 1 ms.
- The remote array opens the buffer request and responds back to the host. COST: 1 ms
- The host sends the write to the remote array. COST: 1 ms
- The remote array forwards the write to the local array. COST: 1 ms.
- The local array stores and acknowledges the write back to the remote array. COST: 1 ms.
- The remote array acknowledges back to the host that the write is complete. COST: 1 ms.
1 + 1 + 1 +1 +1 +1 = 6 ms.
2.2 ms compared to 6 ms.
Even though they achieve the same thing: a protected write.
This is called a non-optimized write.
You can understand how customers who use this might be interested in the latency policy. Avoiding non-optimized writes important when the distances are significant–and having some intelligence to automatically figure this out is even better.
Side note: Now reads have less penalty than writes because they don’t need to go to both arrays and there is also slightly less back and forth between the host and array so the write is the worse case scenario. Also this is SCSI–the write process is a bit more efficient with NVMe-oF, but regardless the penalty will exist at some level on non-optimized I/Os over distance.
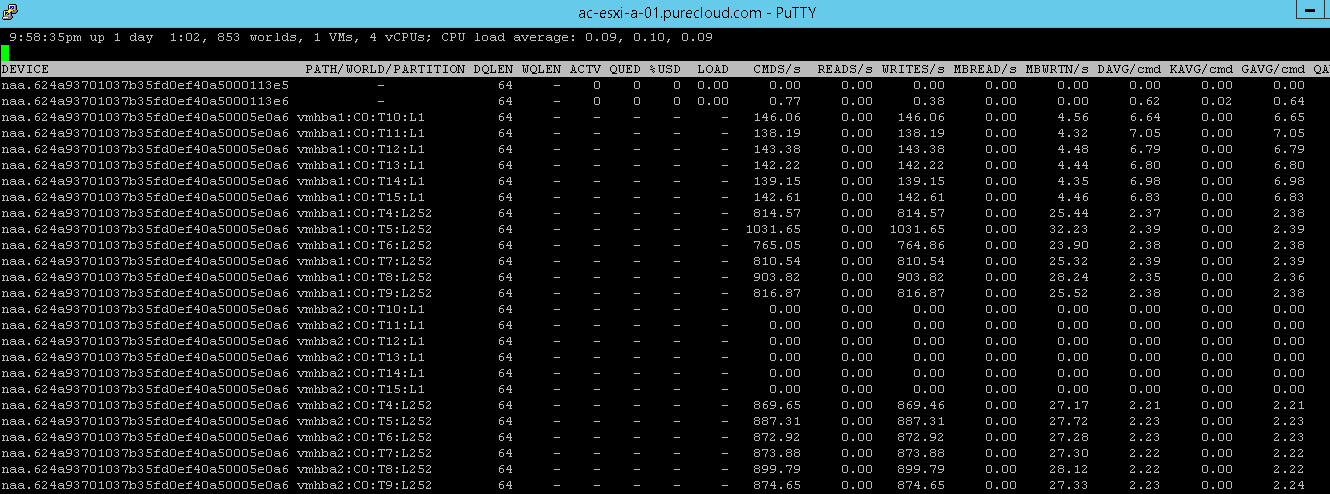
I have a workload running that is configured to tell the VM to push as much as it can at 32 outstanding I/Os of 100% 32 KB writes to a replicated volume. With regular IOPS switching round robin all paths will be used equally, both optimized and non-optimized:
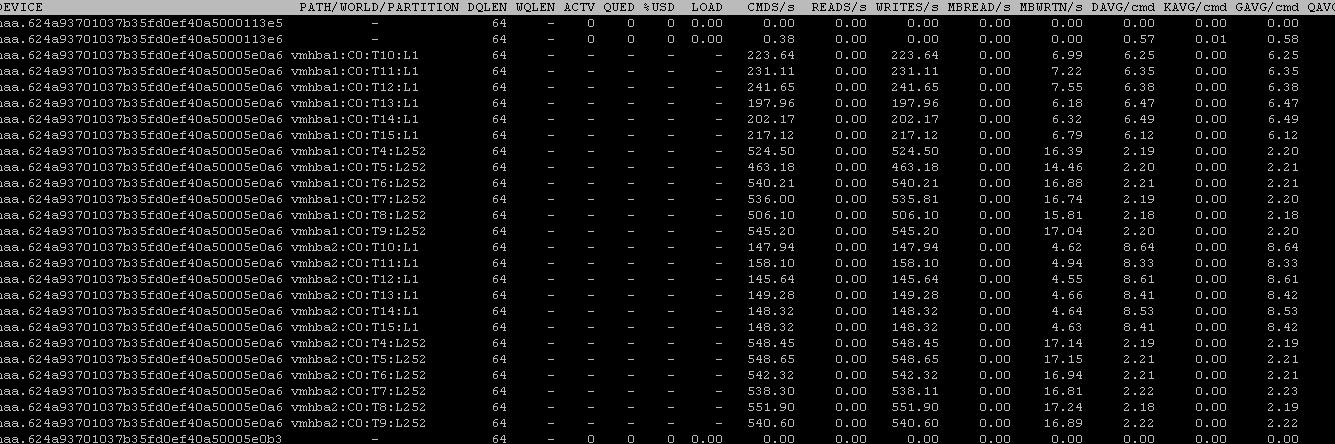
As you can see half of the paths are at that 6 ms (or worse). The rest (the optimized paths) are right at ~2.20. With all of the paths (20 in total) the workload is pushing about 8,500 IOPS in total. Even though there is a big difference in the paths, they are being used equally.
This is not ideal.
Active-Optimized/ Non-Optimized Advertising
Prior to the latency round robin option there were other ways of avoiding non-optimized paths. What we (Pure) do on the FlashArray is use the concept of a preferred array. If a host has access to both arrays–we provide the option to configure on the arrays, which host is “local” to it. If the host is local to it, the paths from the host to that array are advertised back to the host as “active-optimized”. The paths on the other array are advertised back as active-nonoptimized.
When I configure this, in the below screenshot you can see some paths are marked Active I/O (meaning they are being actively used for I/O) and other just Active (meaning they are available, but not being used).
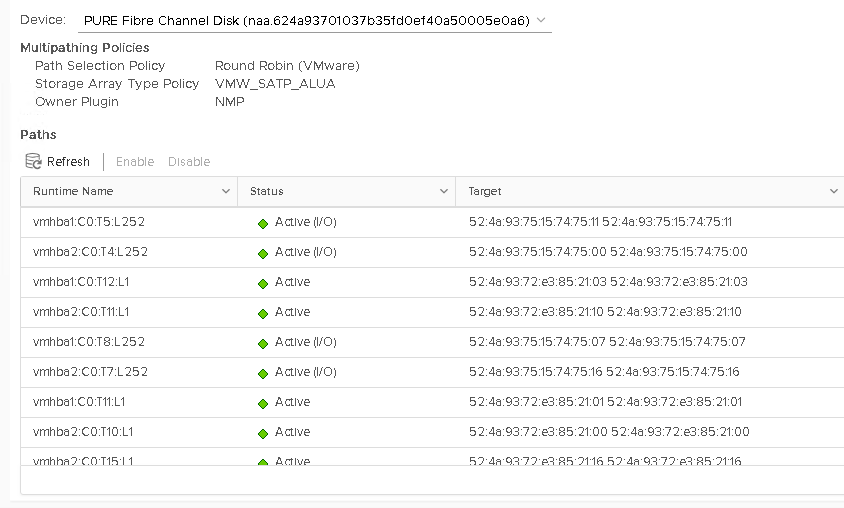
Using traditional round robin, this was the only way to automatically have ESXi avoid using non-optimized paths. Non-optimized paths would only be used if ALL of the of optimized paths went away.
The workload increases to 13,500 IOPS–by simply excluding certain paths. Because ESXi no longer has to wait for half of the I/Os for twice the amount of time, it can push more I/Os in the same amount of time.
Latency-based Round Robin
Now with 6.7 Update 1, you could instead opt to use the new latency-based policy. Using the same environment as above, I will disable my array from advertising optimized/non-optimized so that ESXi sees all paths the same. I will then set my datastore on that host to use the latency-based round robin policy.
esxcli storage nmp psp roundrobin deviceconfig set --type=latency --device=naa.624a93701037b35fd0ef40a50005e0a6
If you remember from above some of my non-optimized paths were around 6 ms and others were a bit above 8 ms. After some troubleshooting it seemed my latency simulator was slowing down some of the paths more than the others, but I decided to keep it that way because it helps make my point here.
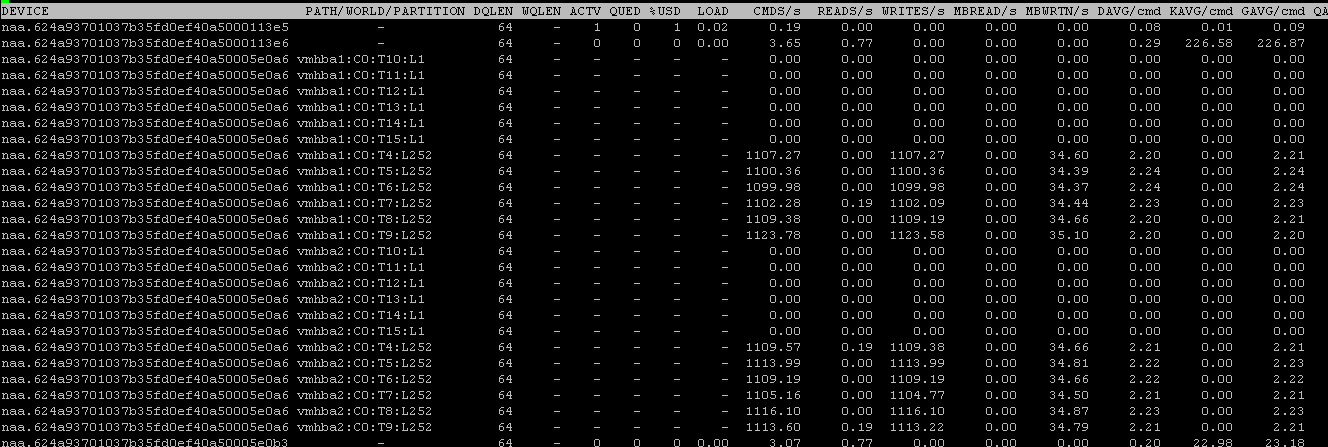
The worst paths (8ms+) were dropped pretty much immediately:
And the remaining non-optimized paths were still being used for a bit eventually (few minutes) those were dropped too in favor of only optimized paths.
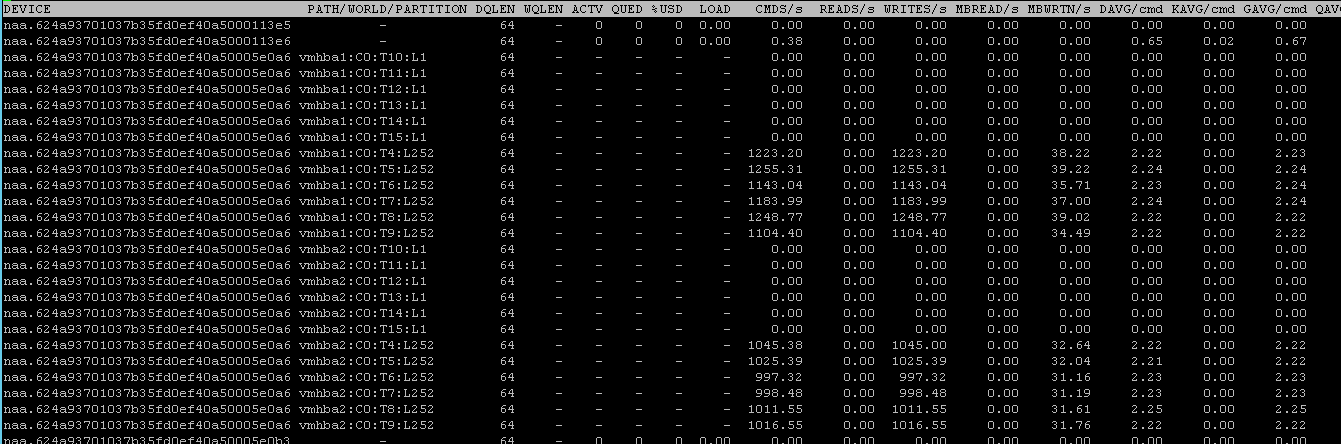
The IOPS was back at 13,500 again.
Q&A
Before I get into it let me re-iterate this: as I said in my previous post, I am not going to 100% recommend the latency policy until we (Pure) can complete full testing internally on it. But for the purposes of this Q&A let’s put that aside for a moment and let’s talk in theory about the results I have seen and pretend we have finished testing.
As we do more testing, I will update these and possibly include links to more posts. (last updated 10/18/2018)
Which option should I use?
Good question. If you’re replicating FlashArrays are pretty close where the latency is not that different, I would suggest not using the preferred array settings on the FlashArrays and letting the latency policy decide. This is what we recommended before the latency policy existed anyways. Preferred array settings on the FlashArray is really targeted for use at geographically separated arrays. If they are separated, you now have a choice. If the latency difference is quite high, I would still set the preferred array to ensure those paths are only used in times of need (all of the active go down). If your difference in latency is not as big (or you don’t care about the difference) then just use the latency policy. If you want to reduce traffic in general across the WAN–definitely use the preferred array and latency policy. This allows the preferred array setting to have VMware only use local paths if they are available, and the latency policy to discard any local paths that happen to be misbehaving.
Is there a time I shouldn’t use the latency policy?
Well, if you haven’t tested it yet (or your vendor doesn’t recommend it) then don’t. Until I complete further testing I don’t know the full extent of this answer.
What are the options for the latency policy?
There are three:
- num-sampling-cycles. Default: 16. Valid values are 16-2147483647
- latency-eval-time. Default: 180000. Valid values are 30000-2147483647
- useANO. Default 0. Valid values are 0 or 1. If set to 1, ESXi will ignore ALUA settings and still use active non-optimized paths if their latency is deemed good enough. This is basically like enabling the latency default policy without enabling the preferred array setting on the FlashArray.
Why 2147483647? Well I guess they gave a 32 bit value space for this and that is the highest signed binary integer 32 bit allows for. Fun fact: yes it’s a prime number! More fun fact: yes it looks like a phone number in Dallas. And yes I called it. And no, no one picked up 🙁
Should I change the default values?
At this point in time, I have not seen much value in changing the number of sample periods or the evaluation interval time. So as of now, keep the latency policy to the defaults.
What if I am not using active-active replication?
Yes I used that as an example, as it is probably the most common example of different latencies on different paths. But of course, you can use it for “normal” volumes. Situations can arise that could cause one path to be better than another–so yeah why not?!
Can it improve performance in normal circumstances?
Unknown. I have not found that to be the case yet, but much more testing is needed. More mixed, heavier workloads etc.
Will it work with RDMs? VMFS? VVols?
Yes, yes, and yes.
How do I see the current device config?
Run:
esxcli storage nmp device list --device=naa.624a93701037b35fd0ef40a50005e0a6
naa.624a93701037b35fd0ef40a50005e0a6
Device Display Name: PURE Fibre Channel Disk (naa.624a93701037b35fd0ef40a50005e0a6)
Storage Array Type: VMW_SATP_ALUA
Storage Array Type Device Config: {implicit_support=on; explicit_support=off; explicit_allow=on; alua_followover=on; action_OnRetryErrors=on; {TPG_id=3,TPG_state=AO}{TPG_id=2,TPG_state=AO}{TPG_id=0,TPG_state=AO}{TPG_id=1,TPG_state=AO}}
Path Selection Policy: VMW_PSP_RR
Path Selection Policy Device Config: {policy=latency,latencyEvalTime=180000,samplingCycles=16,curSamplingCycle=16,useANO=0; CurrentPath=vmhba1:C0:T8:L252: NumIOsPending=3,latency=2}
Hi Cody!
As always an amazing post, i think this is like a EMC powertpath open source? jajajaja
Best regards
Thanks! Hah well with not having access to PP/VE I couldn’t say for sure, but I would suspect the value of it does diminish. But it is tailored for certain EMC arrays, so if they have non-standard front ends it might still be better for them.
This looks real interesting and I see the potential. Is there any updates on how the testing is going?
So far so good. I think by the end of 2019 we will shift to this being the default best practice.
Any thoughts on how to query a particular SCSI LUN via PowerCLI to verify its latency policy and related settings? Get-SCSILun will show “CommandsToSwitchPath : 0” and “BlocksToSwitchPath : 0” on a LUN where the new latency policy is active but I can’t dig out any details. I’ve looked in the ExtensionData property and also tried Get-SCSILunPath to no avail…
I’ve also tried to implement a SATP rule with “policy-latency” in a host profile. The rule gets created then I reboot the host to find that random datastores were claimed by this rule, random datastores are still “iops=1” and still others are claimed by a built-in (system) ESXi rule that uses MRU. I’m confused.
This isn’t on Pure, BTW.
Hmm. What does your rule look like? Out of curiosity, is this your post on Reddit?
Also what are the existing rules? Depending on how this is set up I have seen some weirdness with SATP rules in general
Yeah, just use esxcli in PowerCLI. Querying would look like this:
connect-Viserver -Server vcenter-01
$esxi = get-vmhot esxi-02.purecloud.com
$esxcli = $esxi | get-esxcli -v2
$devArgs = $esxcli.storage.nmp.device.list.CreateArgs()
$devArgs.device = “naa.624a937073e940225a2a52bb0002b7c7”
$esxcli.storage.nmp.device.list.Invoke($devArgs)
Return:
Device : naa.624a937073e940225a2a52bb0002b7c7
DeviceDisplayName : PURE Fibre Channel Disk (naa.624a937073e940225a2a52bb0002b7c7)
IsBootUSBDevice : false
IsLocalSASDevice : false
IsUSB : false
PathSelectionPolicy : VMW_PSP_RR
PathSelectionPolicyDeviceConfig : {policy=latency,latencyEvalTime=180000,samplingCycles=16,curSamplingCycle=16,useANO=0;
CurrentPath=vmhba2:C0:T2:L1: NumIOsPending=0,latency=0}
PathSelectionPolicyDeviceCustomConfig :
StorageArrayType : VMW_SATP_ALUA
StorageArrayTypeDeviceConfig : {implicit_support=on; explicit_support=off; explicit_allow=on; alua_followover=on;
action_OnRetryErrors=on; {TPG_id=1,TPG_state=AO}{TPG_id=0,TPG_state=AO}}
WorkingPaths : {vmhba2:C0:T2:L1, vmhba2:C0:T1:L1, vmhba4:C0:T2:L1, vmhba4:C0:T1:L1}
Hi Cody,
Do you know how or when the PSP elects not to use a path? Are the paths that are evaluated the slowest always ruled out even if they might otherwise be considered good?
Pure Support noticed that we have unbalanced IO to our controllers and I think it’s due to the latency based RR. It seems to favor two of four paths at any given time. Which two they are bounce around.
Running a manual ping test, I get average results for all four paths between 0.2 and 0.4ms.
Would the PSP rule out paths that test at 0.265ms if others test at 0.260ms? I wonder if this would result in a net loss of performance due to the reduced number of paths relative to the small latency delta. I haven’t tested that theory yet.
Any way to get at the test data that the PSP is using to make pathing decisions?
Maybe these are questions more for VMware than Pure, but you’re on top of this stuff! 🙂
Thanks!
Mark, what’s the sampling period for their observations? When we run the usual balance tests we see the same thing on quiet (low I/O) hosts. If we sample the connections for a longer period of time there’s actually a good balance. The test just needs more data points.
Hi Cody, thanks for the reply.
I had the same thought pattern as we’ve seen that before on semi-idle hosts before with the regular RR IOPS=1 setting. Increasing the monitor interval (or the load) in those cases does usually show the IO balance out.
I’m not sure what interval support uses in their health check scripts, but I imagine it’s somewhat short.
For my own testing, I increased the interval to 10 minutes and also tried kicking off some SvMotions to bring up the I/O counts and still see the imbalance.
Given a long enough interval (hours or days), the averages might balance out but I think it’s still basically preferring half of the given links at any moment in time.