
The Pure Storage Management Pack for VMware vRealize Operations Manager version 1 is now out! Download it here. This is the latest in our aggressive 2015 roadmap of VMware management integration, whether that be integration point that are new or updated.

So first, what is a management pack? A management pack is a plugin of sorts that can be installed into vRealize Operations Manager (vROPs) that provides context and relationships to existing objects inside vROPs. How these objects are related depends on what the pack represents. In the case of Pure Storage, the pack relates VMware objects, such as VMs and datastore to volumes on a particular FlashArray. This in addition to FlashArray host groups and hosts.
Along with those objects, statistics are imported into vROPs to display, trend and analyze capacity and performance numbers. This allows for quick visual consumption of changes on your storage, in context to your VMware environment, as well as reporting on current status and projecting changes. Pretty powerful tool. I will post more in-depth post on particular use cases and workflows in the near future, but let’s take a look at the management pack overall.
First support requirements:
- VMware vRealize Operations Manager 6.x, Advanced or Enterprise licensing
- FlashArray 4xx series or FlashArray//m
- Purity Operating Environment 4.0.7 or later (needs our 1.3 version of the REST API)
As always, Pure Storage does not license our integration or software, so outside of vROPs licensing, nothing else is required in that arena.
The adapter is installed by uploading and installing the Pure Storage .pak file into the Administration > Solutions pane in vROPs. Pretty standard process (see the video at the end for exact instructions).
Your FlashArrays can be configured once the install is complete, you just need:
- FlashArray virtual IP or domain name
- Read only credentials
Of course admin credentials will work too, but Read Only is all that is needed, because the REST API calls are all non-administrative, they are just queries at this point.
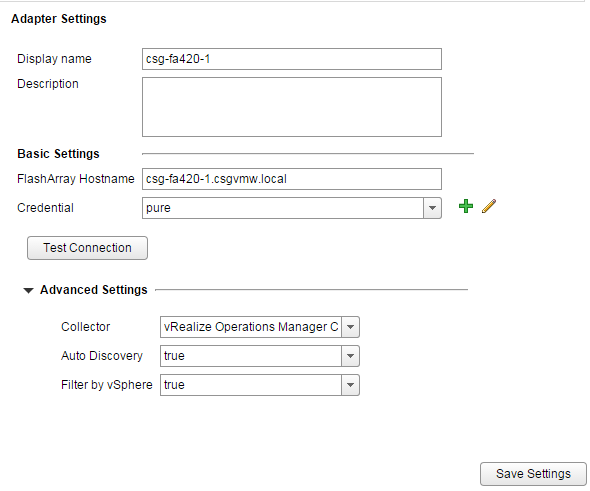 In the advanced settings, there is one option called “Filter by vSphere.” This option controls which objects get ingested from the array, by default this is enabled. This means that only VMware-related objects will be imported, so volumes hosting datastores and the objects related to them (hosts, host groups). If you disable this, then the pack will just import everything. Essentially, this option is based on the decision, are you using vROPs to monitor specifically your VMware environment or everything?
Once the FlashArray is configured, the information will begin populating. Note, vROPs is more of a trending tool then a specific real-time troubleshooting one, so give it some time to get a solid amount of data in it, the more data it has the more accurate and useful vROPs is.
One of the many useful parts of vROPs is automatic relationship of VMware and external objects through the use of packages. As mentioned earlier, we import arrays, host groups, hosts and volumes into vROPs.
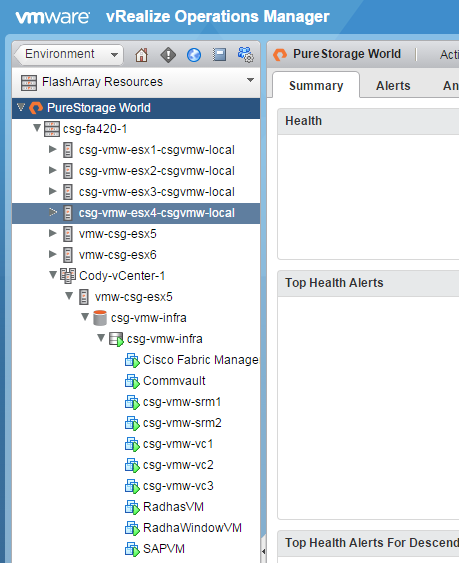
There are a ton of ways to see these relationships, above is a quick view of the whole Pure Storage “world” and drilling down. You can see the one FlashArray has been selected and it drills down into a host group > host > volume > datastore > VM(s).
The next question is, what data do we ingest? Here is a screenshot of the statistics we provide:
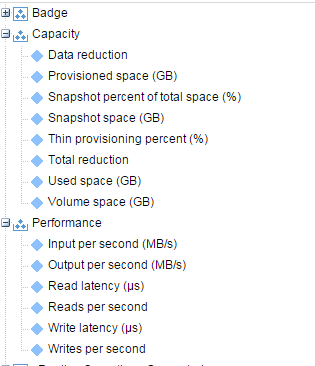
All of the capacity information you should generally need and the normal performance statistics are injected into vROPs by the package. You can use these metrics to create views, reports, projections etc. All of the normal stuff in vROPs itself. To save you some work, we included two dashboards with a variety of different charts to display important information.
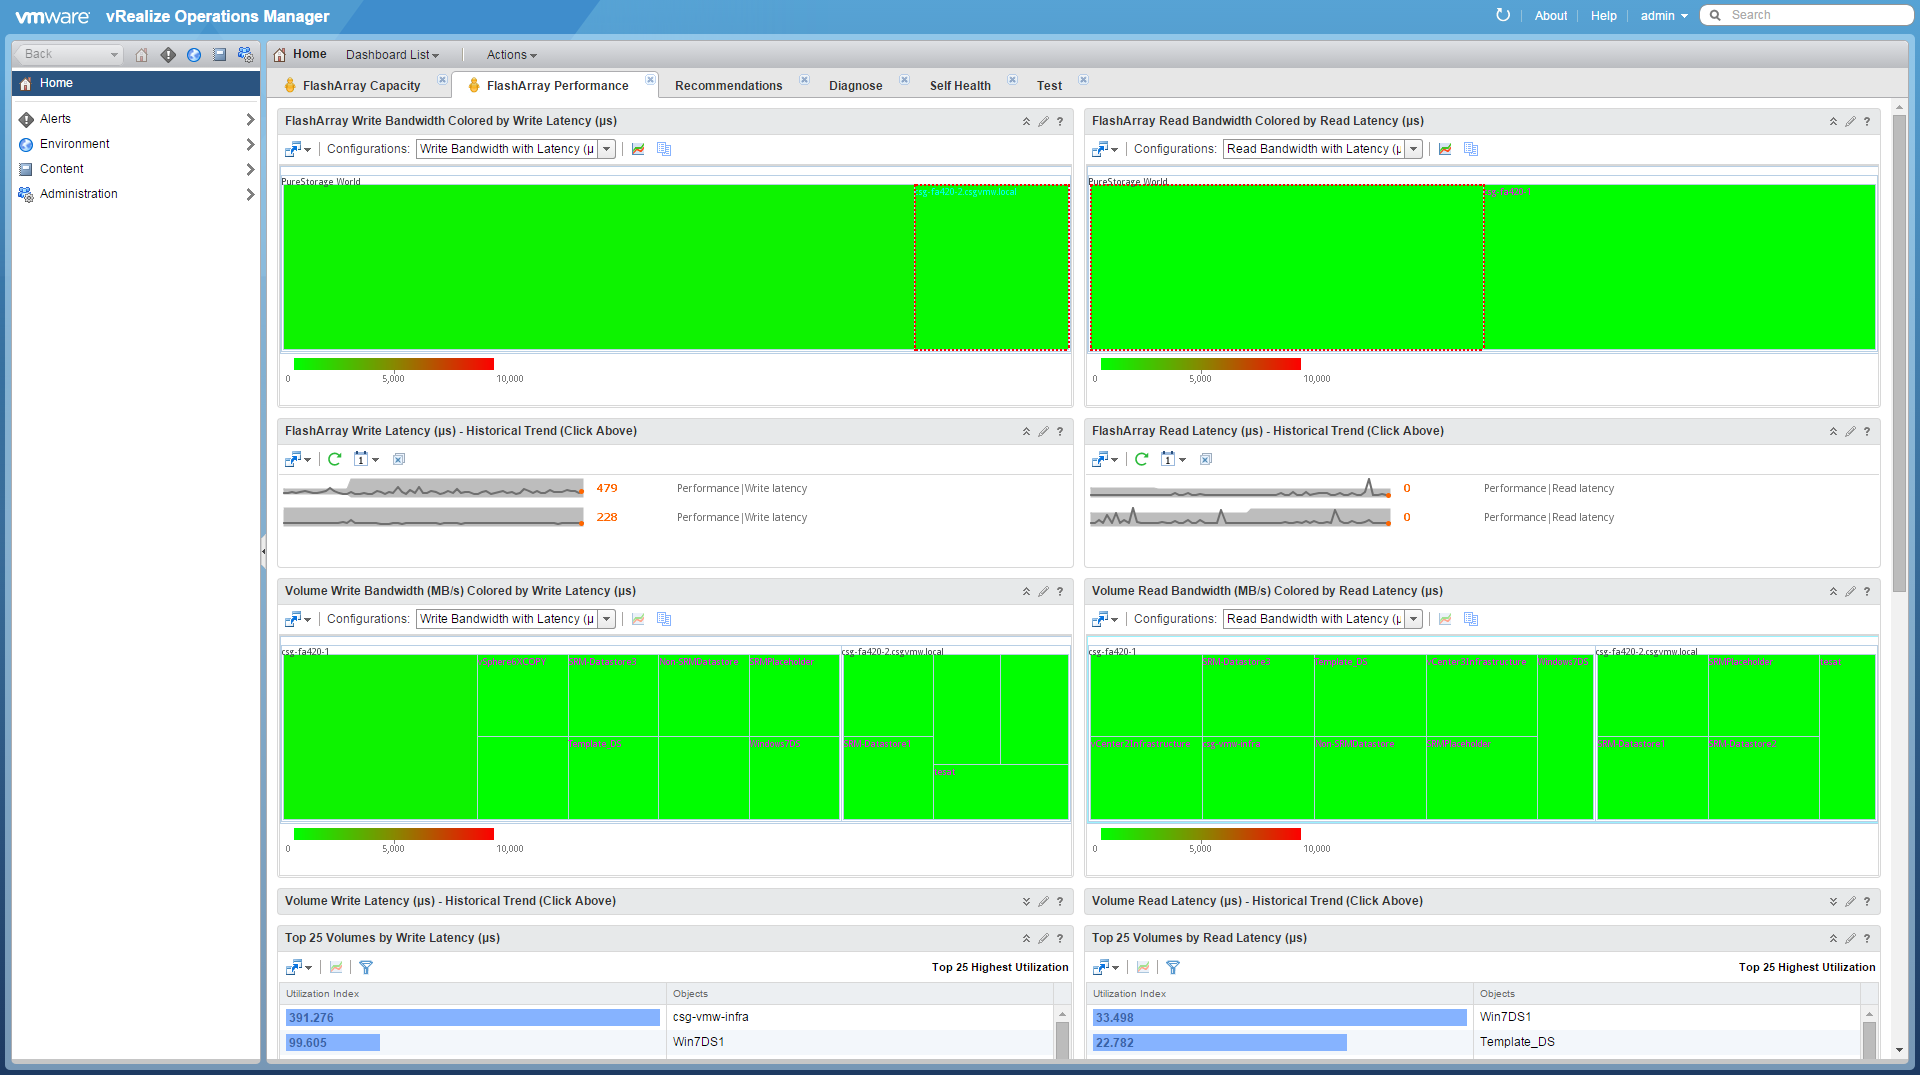
There are two dashboards, one for capacity (8 charts) and one for performance (10 charts). One of the main goals we had for each chart is that we wanted them to be actionable–meaning that by looking at them you could take some action from the information presented if it displayed a problem, or that if you had an issue you could look at them and they could quickly help you identify the problem. Sounds like the same thing I suppose, but one starts with a problem you know, the other starts with looking at the charts and identifying a problem you may not be aware of. We wanted these charts to hopefully fall into one or both of those camps.
I won’t go into the minutiae of each chart, but overall these charts are configured to show the “heavy hitters” and ignore the “small offenders.” You might have 100s or 1000s of volumes in your environment so an overview that includes all of these volume would be overwhelming and useless, so these charts are mainly heatmaps with heavy favor to the top consumers (of either capacity or performance) or top 25 charts that cross all of the FlashArrays.
So answering questions like…
- What volume is using the most physical space?
- What volume is sending the most throughput?
- What host has the highest latency (read or write)?
- What array is the fullest?
- What volume has the most snapshot space?
- etc.
…will be simple to answer.
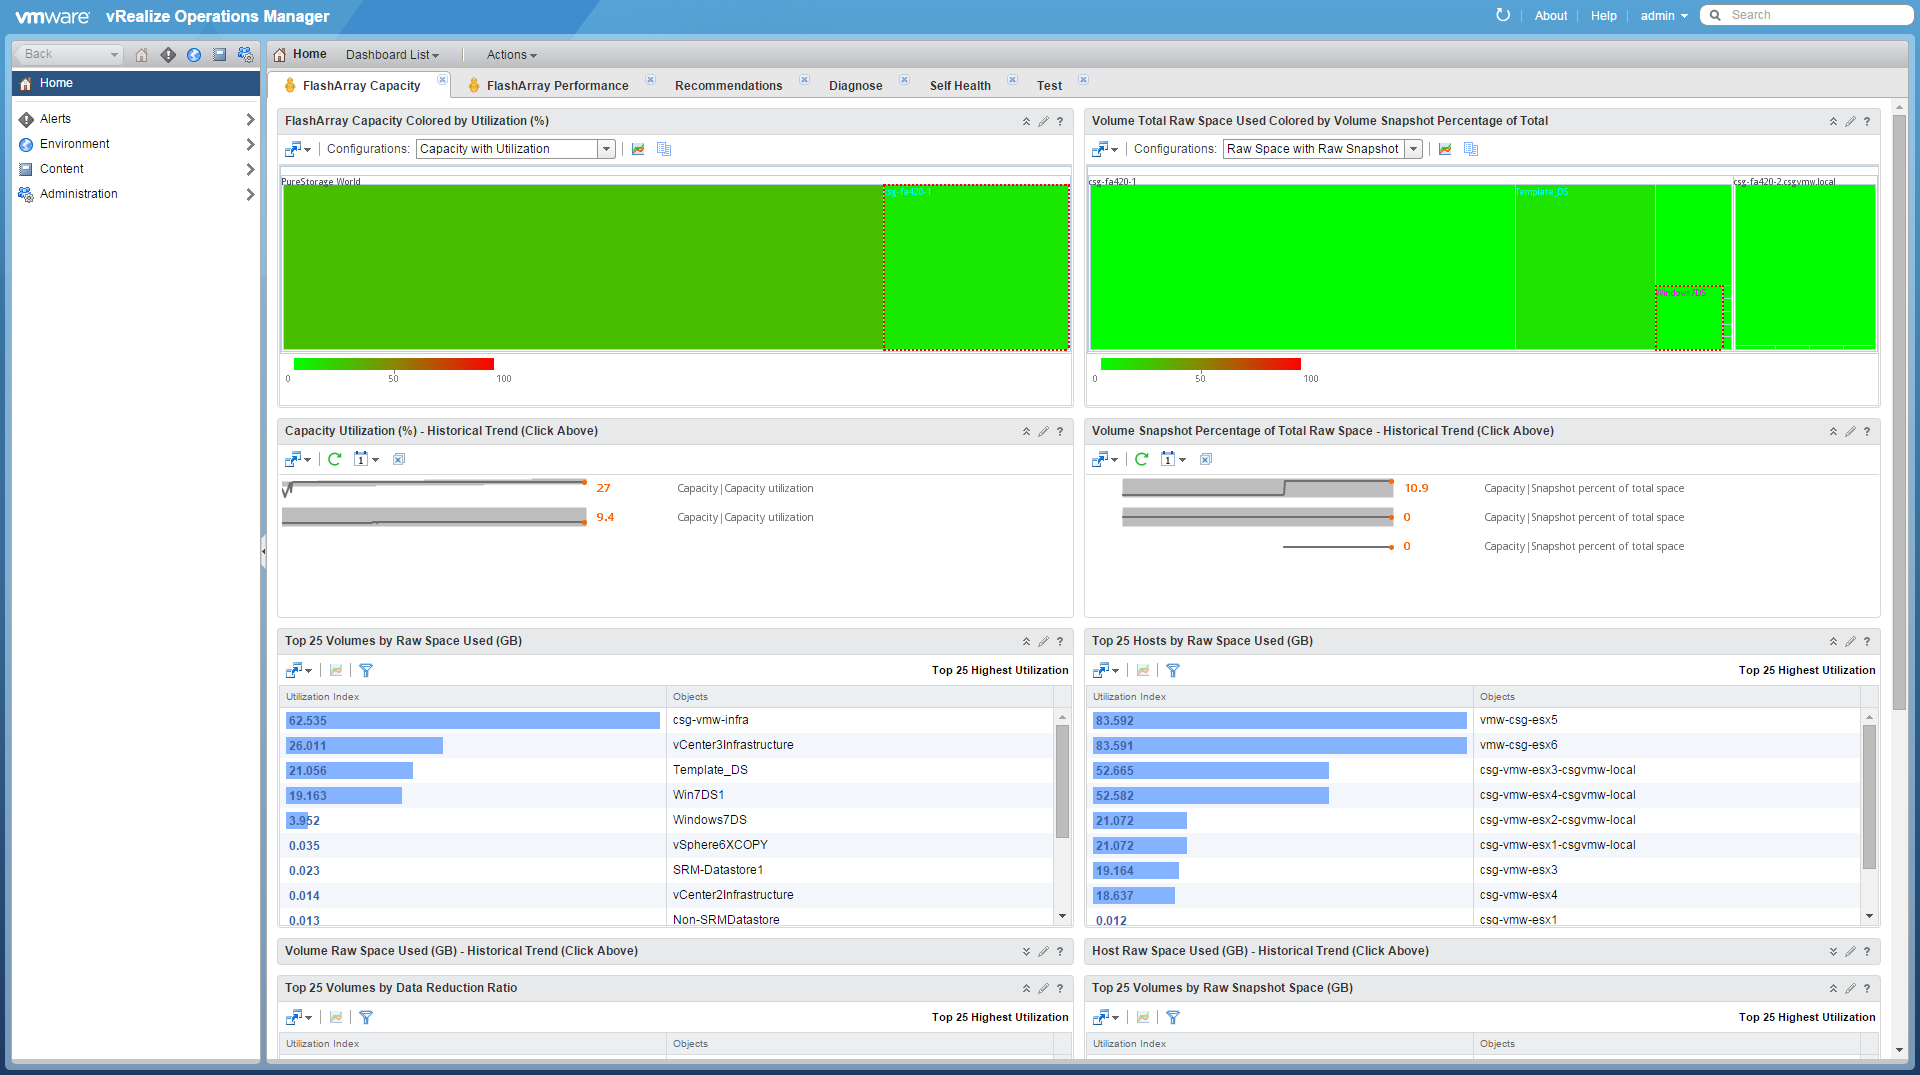
Let’s take a look at two examples. First a capacity heatmap.
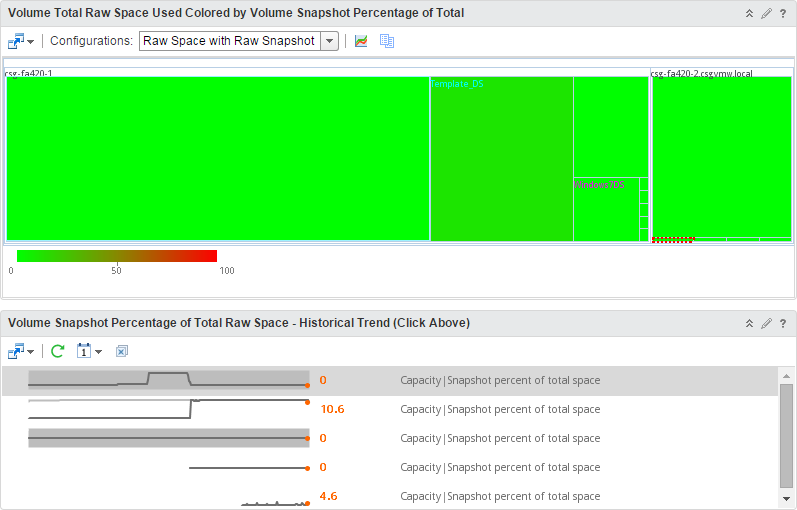
This chart is a heatmap that includes blocks that each represent a volume sorted by FlashArray. Each block shows two things:
- The relative size of a block represents the relative physical amount of SSD capacity used by that volume and its snapshots on the FlashArray as compared to the other volumes. This is the actual physical space being used–so after compression dedupe etc. The bigger the block, the more relative space it consumes.
- It is colored by what percentage of that aforementioned space is only being used because it is reserved by its snapshots. The darker the block, (light green to red) the more of the aforementioned capacity (in point 1) is used by snapshots.
The goal of this chart is to show you if you have a volume that has a lot of physical space used by snapshots, which can be seen quickly by looking for red. Or if you need to reclaim space, you can quickly find what volumes use the most space and which of those a lot of that space is from snapshots. So you can decide do I need this volume and/or do I need all of these snapshots?
The second part of this is a quick trend analysis. If you expand the Historical Trend box directly below it, you can click on the individual blocks (volumes) and see the historical trend of the statistic that determines the color. So in this case the percentage of total space consumed by snapshots. The time period can be changed by clicking the calendar icon (the current selected period is 30 days). If you look at the image above, you can see the one volume that has 10.6% of its space consumed by its snapshots jumped up quickly to that number about 15 days ago. These trend charts are combined with most of the built-in charts in the package.
So how about a performance chart? Here is another heatmap, this time from the performance dashboard.
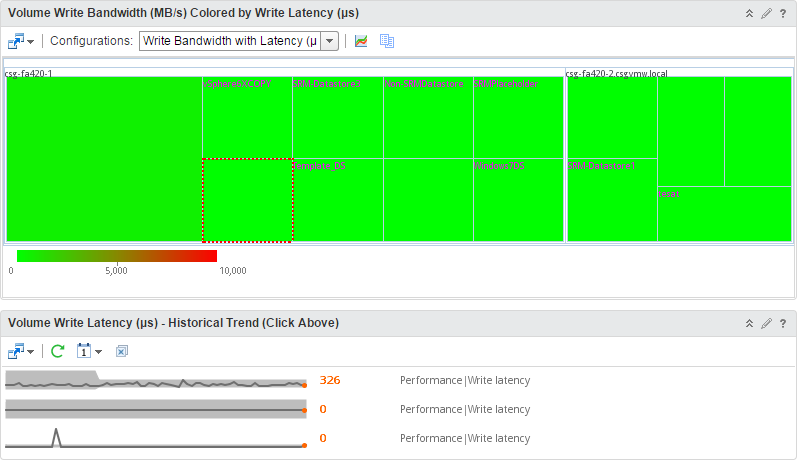
As you can see this chart also includes a trend chart below it. This chart shows individual volumes in the same way as the previous capacity chart, but this time performance related. The blocks are sized by their relative write throughput and are colored by their write latency. Please note the latency is listed in microseconds, not milliseconds. Should be a quick way to see who is either heavy on writes, and/or is not getting the write performance you may want.
The rest of the performance charts are variations on this theme, read or write latency, read or write throughput and read/write IOPS. Either heatmaps or top 25.
Okay the last thing I want to mention is badging.
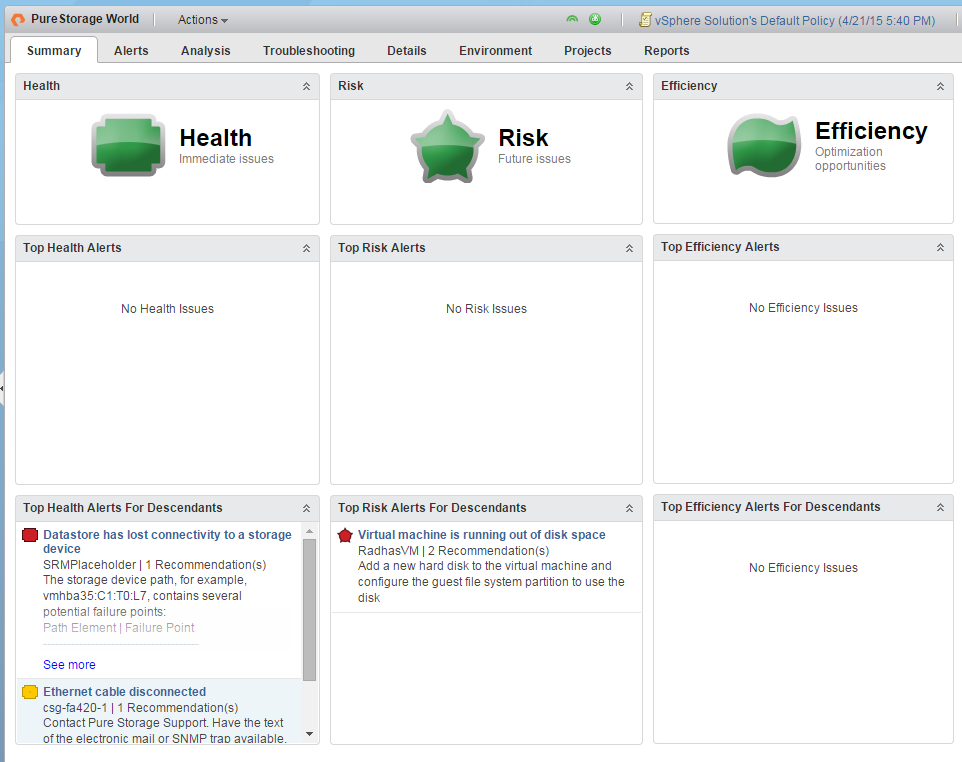
There are three main categories for vROPS, Health, Risk and Efficiency. For the initial release of this package we will be focusing on the first two, health and risk. Health will be changed by things like alerts sent from the array (an example of a ethernet cable disconnected is displayed above). These alerts often include a recommendation on what should be done about it, like something as simple as “contact Pure Storage support” or “check out this KB article that might be related.”
So, that’s the general overview of version one of the adapter. In subsequent posts, I will be going into some more detail one what more can be done to leverage the information inserted into vROPs and what else can be customized. What is mentioned here is the very basics and the tip of the iceberg.
Video demo:
Cody,
Instead of credentials, can this pack be configured using an API token?
Not at this time, it requires username and password. We are updating our mgmt pack soon. Is this something you need to be done?
When attempting to connect my arrays to the vROPS plugin, I get the following error: “Unable to establish a valid connection to the target system. Error requesting API token”
Hmm i tested this with local pureuser and active director users (read only, admin, storage admin) and couldn’t re-create. What versions of vROPs/purity/pack do you have? You using pureuser or a directory service?
Did this ever get resolved?
I’m seeing the exact same issue today. v8.12 running mgmt pack 3.2.0