
I have written a few posts recently on using the Pure1 with PowerShell, like below:
- https://www.codyhosterman.com/2019/01/using-the-pure1-powershell-module/
- https://www.codyhosterman.com/2019/01/using-the-pure1-rest-api-part-i-powershell/
I made a PowerShell module you make it easy for you to use, which can be installed via install-module from the PowerShell gallery. Details here:
https://www.codyhosterman.com/scripts-and-tools/pure1-rest-api/pure1-powershell-module/
In this post, I will walk through using the module to pull performance metrics from Pure1, which I think is one of the most valuable parts of the Pure1 REST.
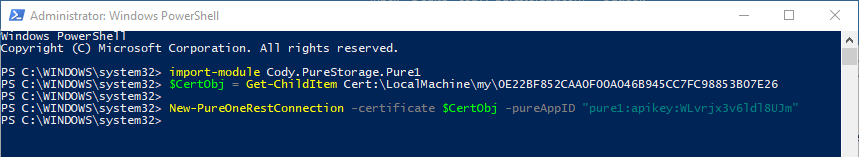
Note this process has been improved to connect and use certificates:
The first step is connecting. So run import-module (or install-module if you haven’t already). Then use the New-PureOneRestConnection cmdlet to connect. Pass in your application ID and certificate. You can find more information on that process in the above links.
There are bunch of cmdlets in the module, but let’s say I want to get the busy meter from a particular array. If you are not familiar with that metric, it is a calculated metric saying “how busy” that array is. It takes into account front end workload, background tasks, replication etc. and says in a percentage, how busy that array really is. This metric is called array_total_load.
When pulling a metric from Pure1, you need to specify a few things:
- The metric name
- The array or object (volume, file system, pod, etc.)
- The resolution. Basically at what granularity you want to report on. Every hour, every day etc.
- The start time. How far back do you want to go
- The end time. When should you sample to.
- Aggregation. Do you want the average for that time period, or the maximum?
My PowerShell module does a lot of this for you. To find more information, or find the available metrics, you can run Get-PureOneMetricDetails.
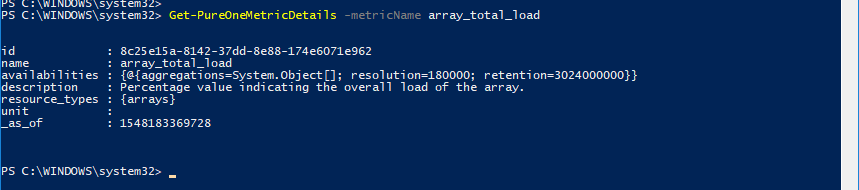
If do not enter a metric name, it will return all available metrics. In the above example I pull the information for the busy meter metric. It tells you how granular the metric is kept (resolution, which is reported in milliseconds) and how long the metric is kept (retention, which is reported in milliseconds). So in the case of the total_array_load, the granularity is 3 minutes and it it kept for 35 days.
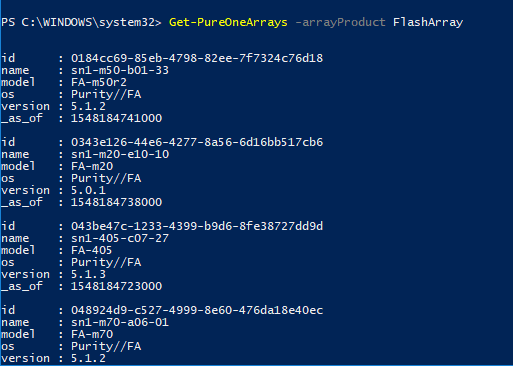
Since I think the busy meter is a very important, useful metric, I made a specific cmdlet to get it. Get-PureOneArrayBusyMeter. The only required metric is an array name. You can get your array name in a variety of ways, one is the cmdlet, Get-PureOneArrays. You can filter it down by the array name, the array ID, type of array (FlashBlade or FlashArray). Or just run it without parameters to get all of your arrays.
Once you get your array, now you can get the busy meter for it. I will use my x90r2 named sn1-x90r2-a05-22.
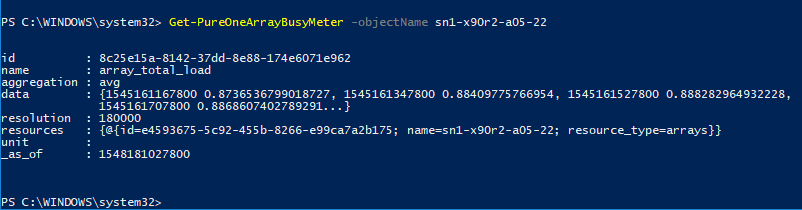
The cmdlet is written in a way to make using this easy. You only need to pass in the array name. By default it will fill in the rest:
- Resolution. It queries for the limits using get-pureonemetricdetails and uses the minimum granularity. In this case, 3 minutes.
- Start time. It finds how long we keep the data and then uses the earliest date available (so in this case 35 days ago)
- End time. Uses the current time.
- Aggregation. It defaults to average is none is specified.
So in the above example, it will return the last 35 days of data, with the average of every 3 minute period. So quite a lot of data. In the below example, I stored the result in an object called $busyMeter.
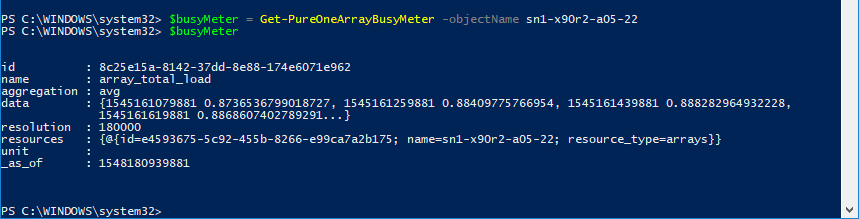
To access the data, it is stored in the property called data.
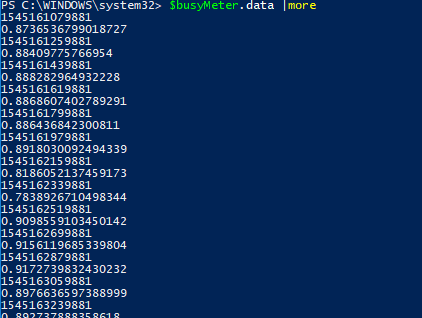
Each data point contains the data point time (in Unix time in milliseconds) and the busy meter value, which is a percentage. So above at the time 1545161079881 (which is Tue Dec 18 2018 11:24:39 pacific time), my array was 87.37% busy.
What if we just want the data over the past day, at a granularity of an hour and report the maximum for that hour, not the average?
So the inputs is in the PowerShell type of DataTime. So use the get-date cmdlet.
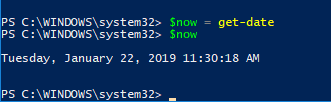
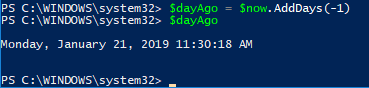
Get-date gets us now, but we want the start date to be 24 hours ago. So just remove 24 hours. This can be done (counter-intuitively) with the addDays() method. Just put in negative 1 to remove a day.
We also want the resolution in millseconds. So an hour would be 3600000 milliseconds. Lastly to specify we want the maximum, not the average, just use the -maximum parameter. So like below:
Get-PureOneArrayBusyMeter -objectName sn1-x90r2-a05-22 -maximum -startTime $dayAgo -endTime $now -granularity 3600000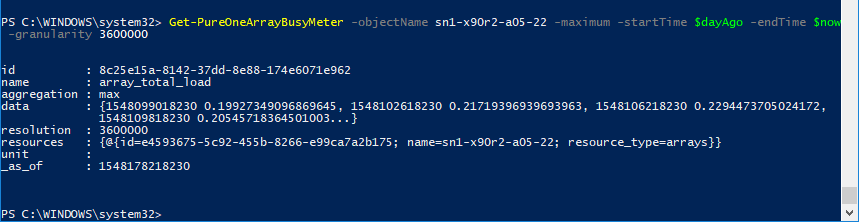
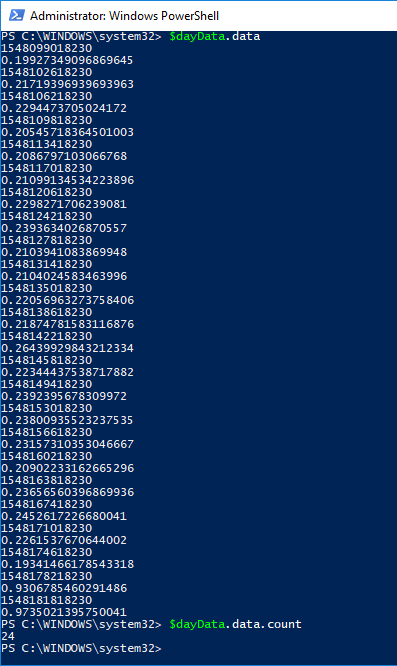
If we store that in an object called $dayData, we see we get 24 results (one per hour)
Easy!
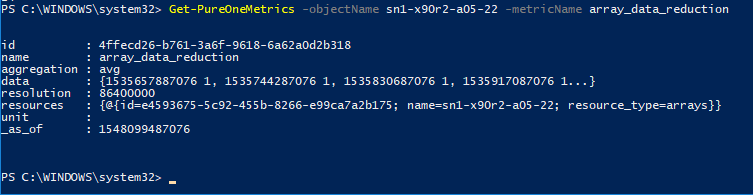
For all other metrics, you can use the cmdlet Get-PureOneMetrics
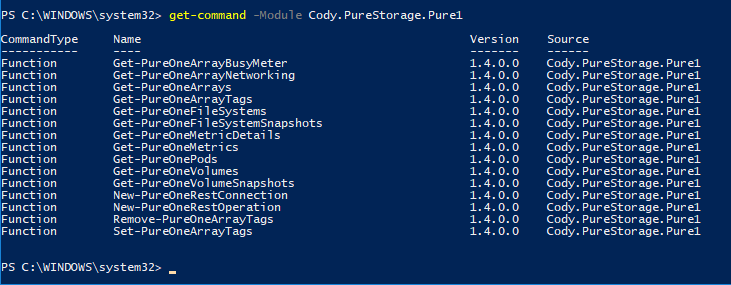
In addition to the above I created a lot of other cmdlets:
Check this page for the latest updates