
vSphere 6.7 core storage “what’s new” series:
- What’s New in Core Storage in vSphere 6.7 Part I: In-Guest UNMAP and Snapshots
- What’s New in Core Storage in vSphere 6.7 Part II: Sector Size and VMFS-6
- What’s New in Core Storage in vSphere 6.7 Part III: Increased Storage Limits
- What’s New in Core Storage in vSphere 6.7 Part IV: NVMe Controller In-Guest UNMAP Support
- What’s New in Core Storage in vSphere 6.7 Part V: Rate Control for Automatic VMFS UNMAP
- What’s New in Core Storage in vSphere 6.7 Part VI: Flat LUN ID Addressing Support
VMware has continued to improve and refine automatic UNMAP in vSphere 6.7. In vSphere 6.5, VMFS-6 introduced automatic space reclamation, so that you no longer had to run UNMAP manually to reclaim space after virtual disks or VMs had been deleted.
The problem with this was that it was asynchronous and also very slow. It could take up to a day to reclaim space. VMware did this for a valid reason–a lot of legacy arrays did not like heavy UNMAP I/O. Modern all-flash-arrays on the other hand handle UNMAP exceptionally well–especially meta-data based AFAs, like the FlashArray.
To make those customers happier, VMware introduced the ability to tune the UNMAP rate limit on a datastore by datastore basis.
In vSphere 6.5, there were two options: low or off. Low had a reclamation limit of around 25 MB/s.
In vSphere 6.7, this is now configurable to a specific throughput limit.
TL;DR
If you don’t want to run through my investigation here are my findings:
Note that these are my observations–I cannot 100% confirm these statements yet.
UPDATE: I have been talking with some other storage vendors and most of this seems to be accurate for them as well, except for point “3” below. So stay tuned as I continue to hunt this down.
- UNMAP starts as soon as you create dead space (delete a VM or disk, or move one)
- The rate limits are per host, per datastore. If you set the limit to 500 MB/s for a datastore, each host actively using that datastore can run UNMAP at up to 500 MB/s on it.
- If your dead space builds up in small increments UNMAP throttle rates are irrelevant. If the existing dead space is 400 GB or less it will run at 1 GB/s to reclaim it. Once it reclaims 400 GB then throttling will kick in. Though if it finishes reclaiming 400 GB, then a minute later another 400 GB of dead space is created, it will resume at 1 GB/s.
- If only a single host is running UNMAP on a volume it will max out at 1 GB/s. Even if you set the rate higher, a single ESXi will not surpass that throughput level.
- The host that the VMs are deleted from is the host that issues the automatic UNMAP for those VMs. The hosts do not seem to coordinate with one another to reclaim space.
- This does not seem to work at all if the virtual disks are of type “thick”. The limits never seem to kick in. I suspect this might have to do with the difference between SFBs and LFBs on VMFS-6 and something isn’t handling the difference correctly.
Note these numbers and limits might vary from array vendor to array vendor, I have only tested on Pure, so certainly talk to your vendor if there are differences.
If you want the details, read on:
Automatic UNMAP Test
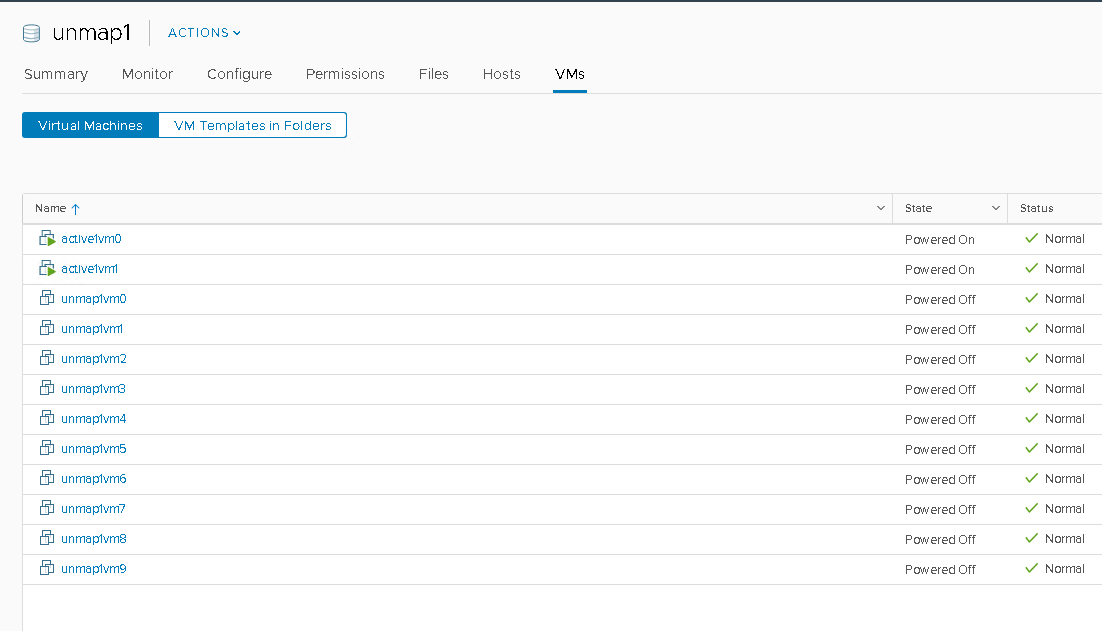
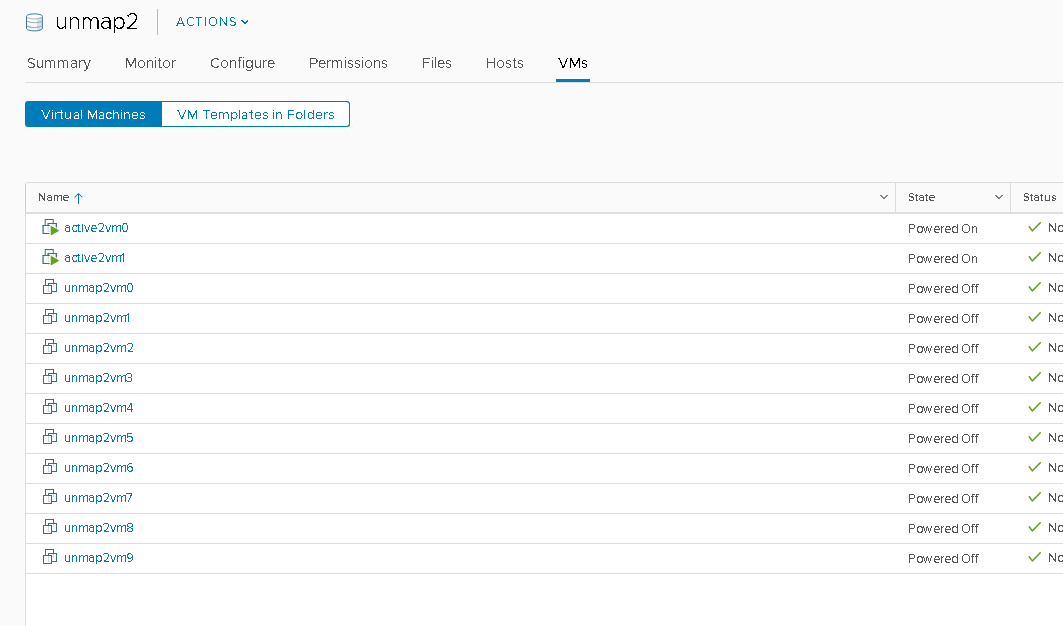
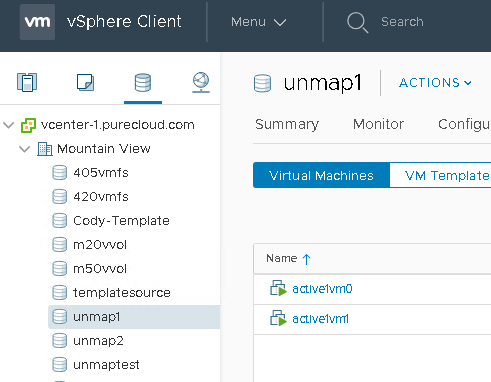
I have a two-host cluster. One VMFS-6 datastore (called unmap1) presented to one host only and another VMFS-6 datastore (called unmap2) presented to another host only.
Each host runs 12 VMs on each datastore:
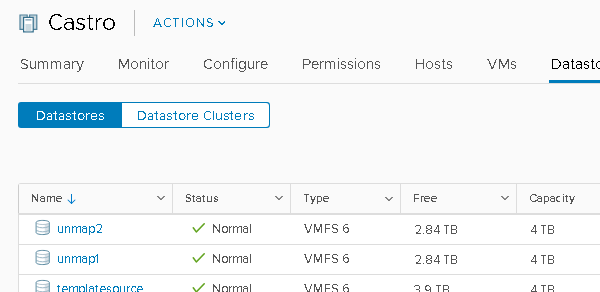
Each one of my datastores has 1.16 TB used:
This is confirmed on the array. If I use the FlashArray value called “thin_provisioning” this tells me how much of the volume has yet to be written to as a percentage.
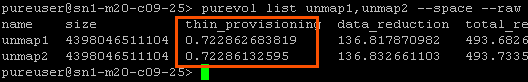
They are both at 72%. If I convert that into GB used, it is 1.14 TB. So the FlashArray thinks there is 1.14 TB written to the volume (before data reduction). Which is pretty much what VMware thinks (1.16 TB).
Note there can be slight discrepancies in this number because thin_provisioning does not include zeroing and VMware does.
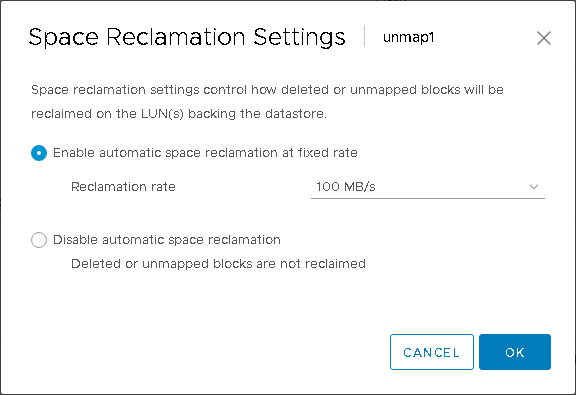
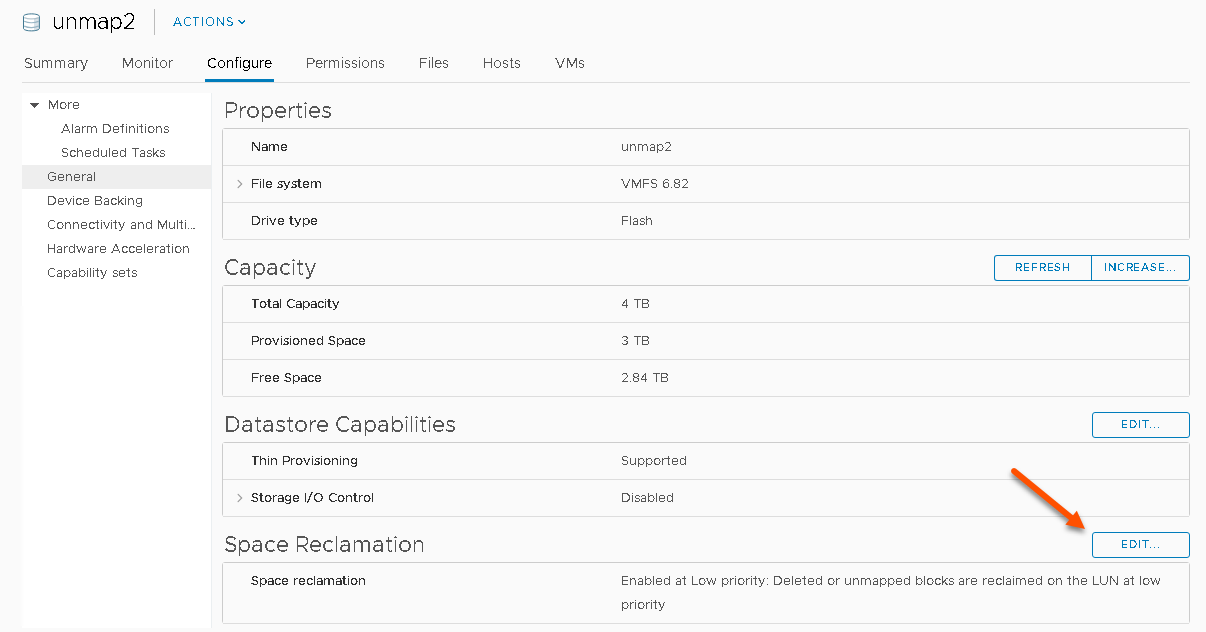
So what I will do next is configure each datastore with different UNMAP priorities.
For unmap1, I will leave it at the default “low” (which is 25 MB/s).

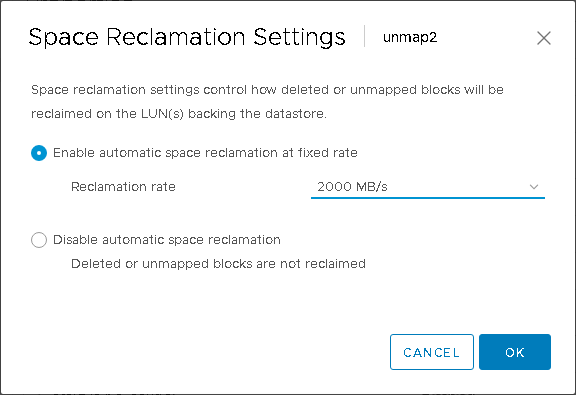
For the other datastore, I will change it to 2,000 MB/s for an UNMAP limit:
I will set it to 2,000 and hit okay
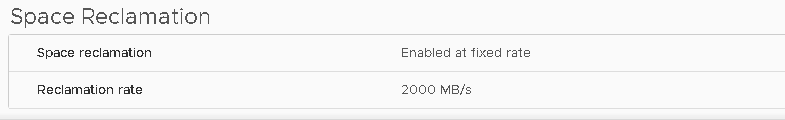
And done:
The next step is to delete some VMs and create some dead space. But first let’s do a little data review.
On my first ESXi host that has the VMs for the datastore called “unmap1” let’s look at the stats. First any UNMAP issued by that host to that datastore can be seen in esxtop. SSH into that host, type in “esxtop” then type “u”. Then “f”, then “o” to add VAAI stats. Press any listed letter to add or remove a column. Then enter to return.
We can see that no UNMAP has been issued yet (note this is only the stats for that host and this also resets after each reboot).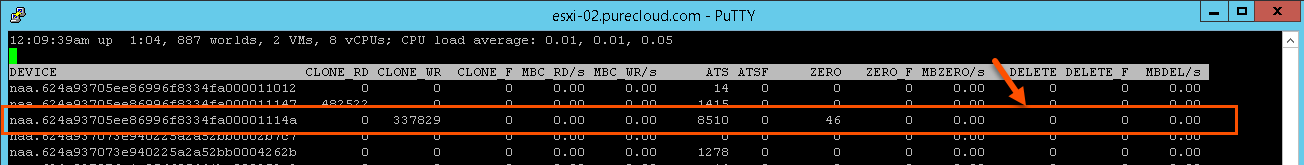 The DELETE column lists how many UNMAPs have been set, and this is listed as zero for my datastore (unmap1).
My other host reports the same thing for my datastore unmap2:
The other place to monitor if the host specifically has issued automatic UNMAP commands to a datastore is through vsish.
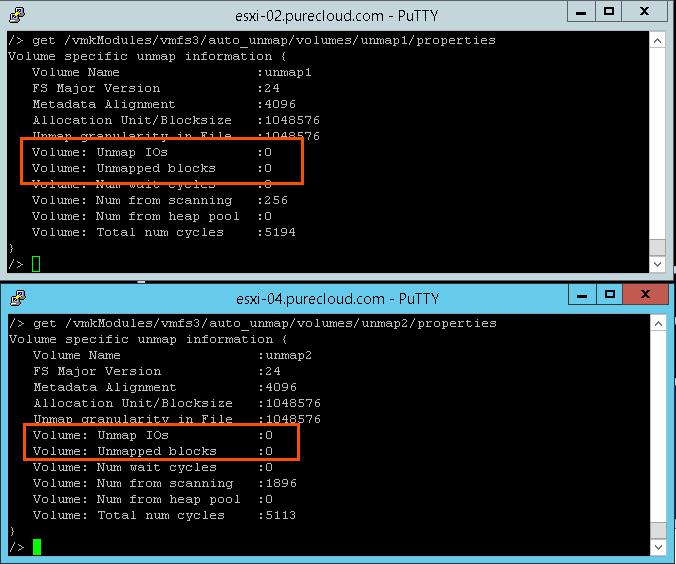
Under “UNMAP I/Os” the host lists how many automatic UNMAP commands have been issued. Both hosts report zero.
See more on both of these UNMAP monitoring features here.
Next I will kick off esxtop recording so I can record the incrementing values on my host.
I will now delete all but 2 VMs on each datastore, leaving those two running.
Starting the UNMAP process
UNMAP starts basically as soon as you delete a VM (or virtual disk) or move it or basically whenever something is removed from the file system.
If I run vsish on my first host (the one with the datastore set to the low priority) we can see it has already begun issuing UNMAP:
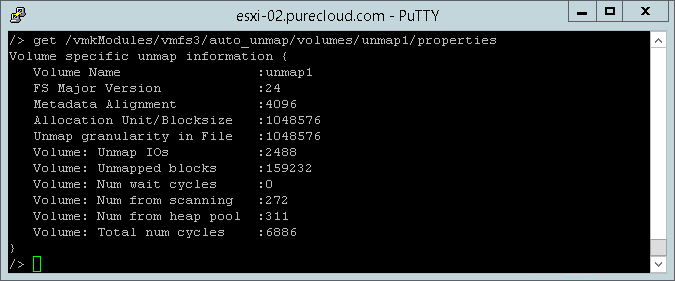
2,488 UNMAP I/Os so far for the low priority datastore (unmap1).
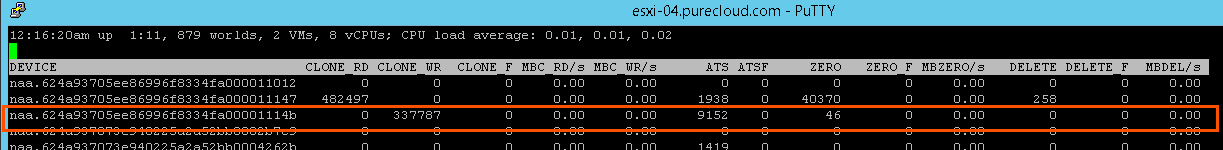
If we look at the other host (the one with the datastore configured for a 2,000 MB/s UNMAP rate), we see something similar:
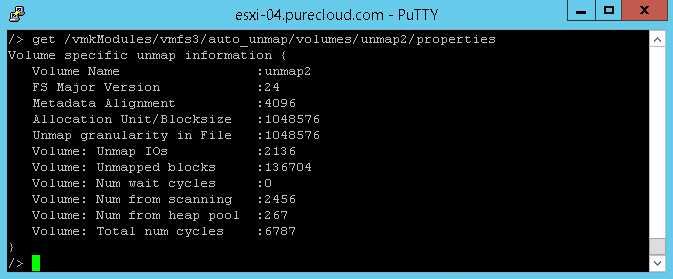
2,136 UNMAP I/Os for the 2,000 MB/s priority datastore (unmap2).
I deleted the VMs on “unmap1” datastore a few moments before the other one so the datastore “unmap2” is a bit behind. But what is interesting is that they are reclaiming at the same rate.
Taking another sample a minute later, they both have reclaimed the exact same amount: around 159 GB. Weird, shouldn’t one be much slower than the other?
If I look about 5 minutes into the process, the first datastore with the default UNMAP priority seems to have stalled: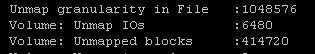
The host is not keeping up with the original rate. And in fact if I refresh it, the number only occasionally increments.
The second datastore though keeps on UNMAP’ing at the high rate:
If I look at my FlashArray, I see that yes, volume two (with the higher priority) has indeed had more space reclaimed if you look at the thin_provisioning value (remember this reports the percentage of the volume that has not been written to, so the higher the percentage the more free space, aka the more has been reclaimed)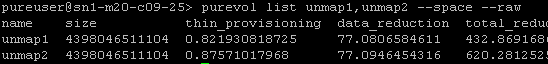
This difference keeps becoming more obvious as time wears on:
![]()
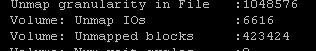
14,310 UNMAPs compared to 6,616.
So, finally my “unmap2” datastore seems to top out:
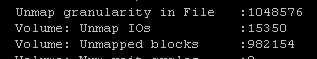
15,350 UNMAP I/Os. 982,154 blocks reclaimed. Let’s look at that second number first.
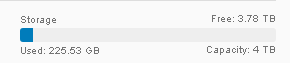
My VMFS now reports 3.78 TB as free. As compared to 2.84 TB from before my VM deletion.
This means that .94 TB (962 GB) of data needed to be reclaimed.
Vsish reported that 982,154 blocks were reclaimed on that datastore. The block size of VMFS-6 is 1 MB. That means 982,154 MB. If we want to convert to GB we need to divide by 1,024. So let’s do some basic math.
982,154/1,024 = 959 GB.
According to vsish UNMAP stats, 959 GB were reclaimed.
Lines up quite nicely–962 GB compared to 959 (the small difference is likely due to sampling/rounding error)–VMware unmapped it all.
Yay math!
So the short answer is that setting the UNMAP rate to higher can definitely speed up the UNMAP process. My reclamation of the 2,000 MB/s datastore took 15 minutes and my default “low” priority one took over six hours. But 2,000 is 80x larger than 25. Why did the datastore with the faster rate only reclaim 24x faster? Not 80x? Something else is going on. Let’s dig in.
Deeper Dive on UNMAP Rates
So, back to my datastore with the default “low” rate. At what rate is it actually reclaiming at?
Side note: while you can see the UNMAP rate in esxtop (MBDEL/s), from what I can tell it is very unreliable at reporting it accurately–especially at low UNMAP rates (my guess is that since it isn’t constant the esxtop sampling misses it).
The DELETE counter in esxtop is very reliable though and when using esxtop recording it can give you a nice picture of UNMAP progress.
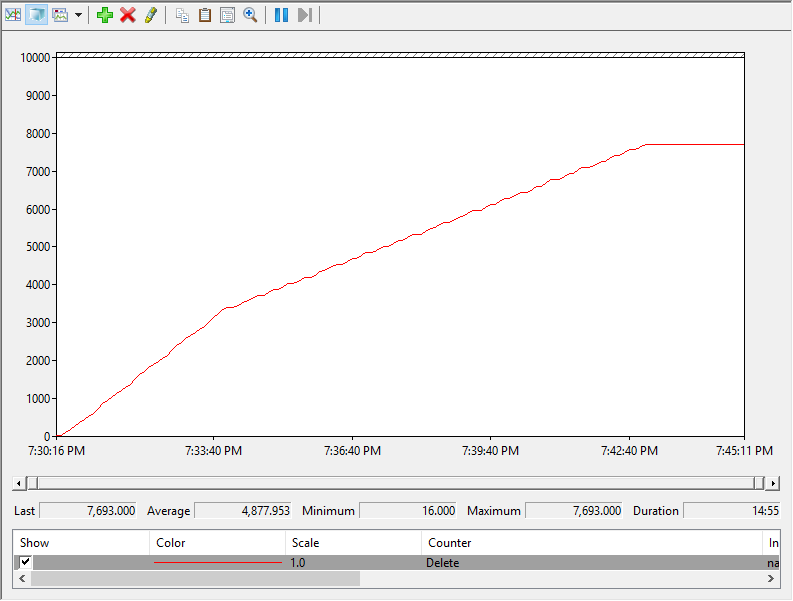
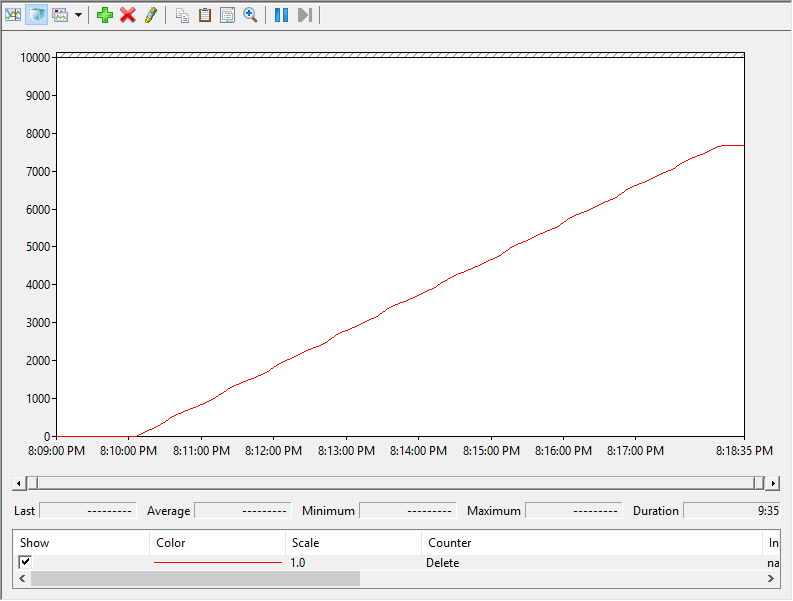
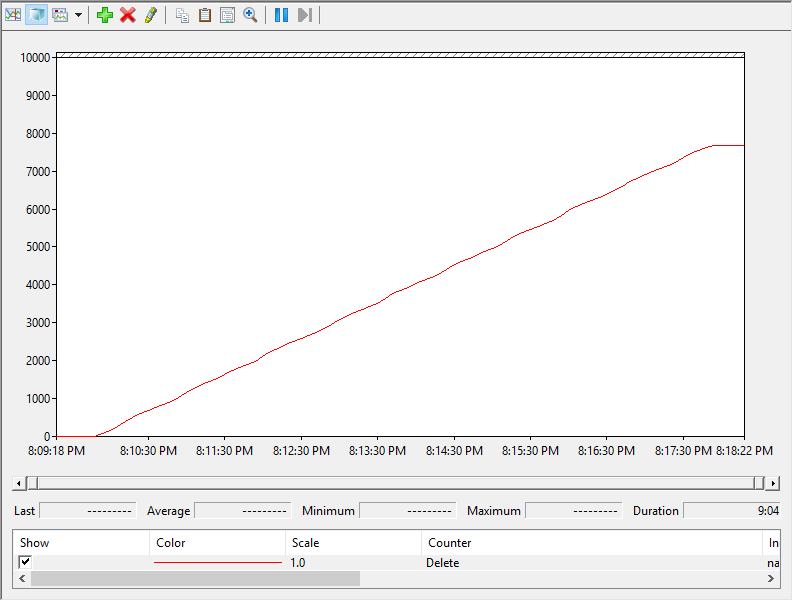
Here is a perfmon printout of my esxtop stats for UNMAP I/Os for the 25 MB/s UNMAP test:
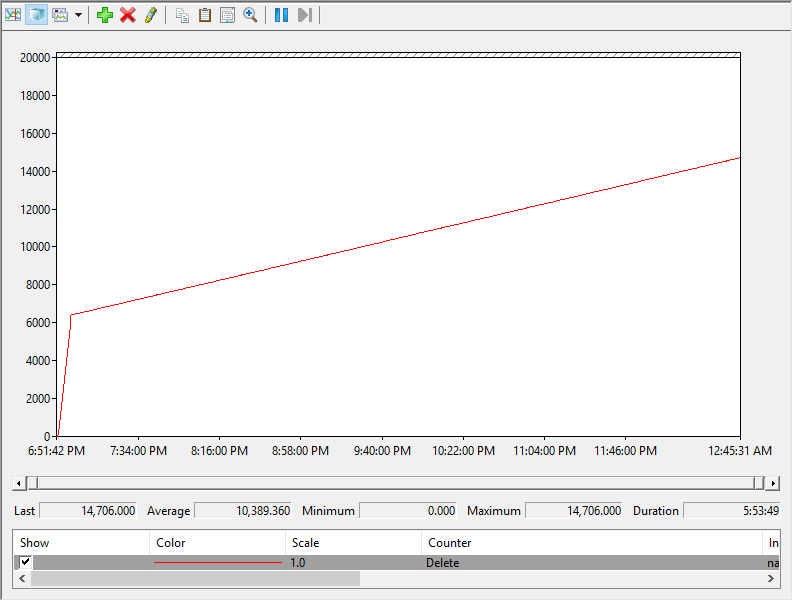
As you can see it went very fast (1 GB/s) until a certain point then it went down to the 25 MB/s throttle rate. The inflection point is once it had issued about 6,400 UNMAP I/Os. In my environment, 64 MB is reclaimed for every UNMAP I/O, so this translates into rate limiting kicked in after 400 GB was reclaimed:
(6,400 * 64) / 1024 = 400 GB
During the less steep portion of the reclaim, I took some grabs from vsish of the UNMAP counts and did a before/after compare. For my datastore with the default “low” priority a point in time of the UNMAP reports 529,920 blocks reclaimed: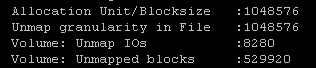
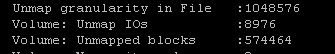
Then 5.5 minutes later it now has 538,624 blocks reclaimed.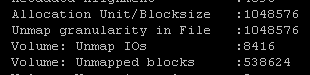 I confirmed this after the fact of course with the above perfmon report of my esxtop stats.
As stated before, these blocks are MB. So during the 5.5 minutes a total of 8,704 MB (blocks) were reclaimed. Which converts to ~26 MB/s. Which is pretty much the 25 MB/s rate the “low” setting is expected to run at. This was taken at the less steep portion of the chart–after the inflection point where rate limiting kicked in.
So it seems that automatic UNMAP limits are not a continuous 100% throttle. It allows UNMAP to run at a high (unthrottled?) rate for a short period and then throttles itself to the specified limit.
I ran a few more tests and it seems regardless to the throughput setting, UNMAP will run at 1 GB per second at the start and then it will drop down (or potentially go up) to its assigned throttle rate once it hits 400 GB reclaimed for that device.
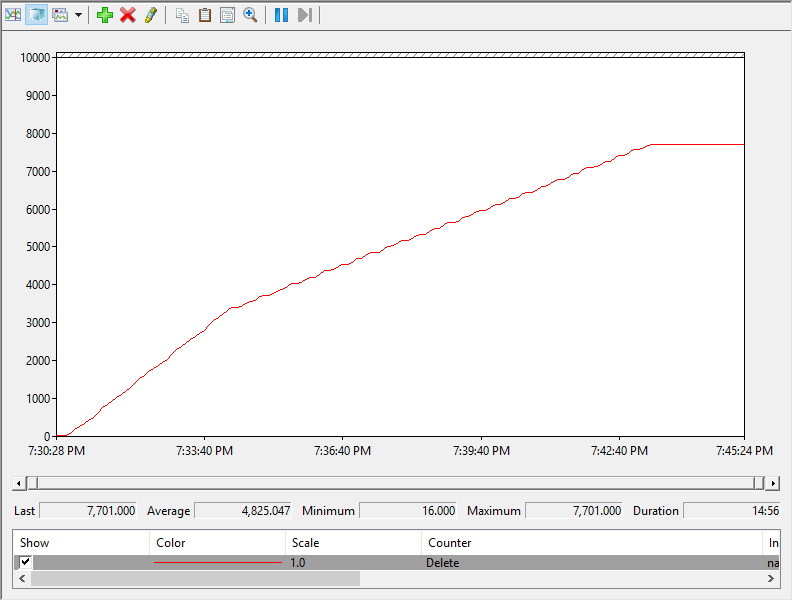
500 MB/s rate limit test perfmon report:
The inflection point here is also at 400 GB.
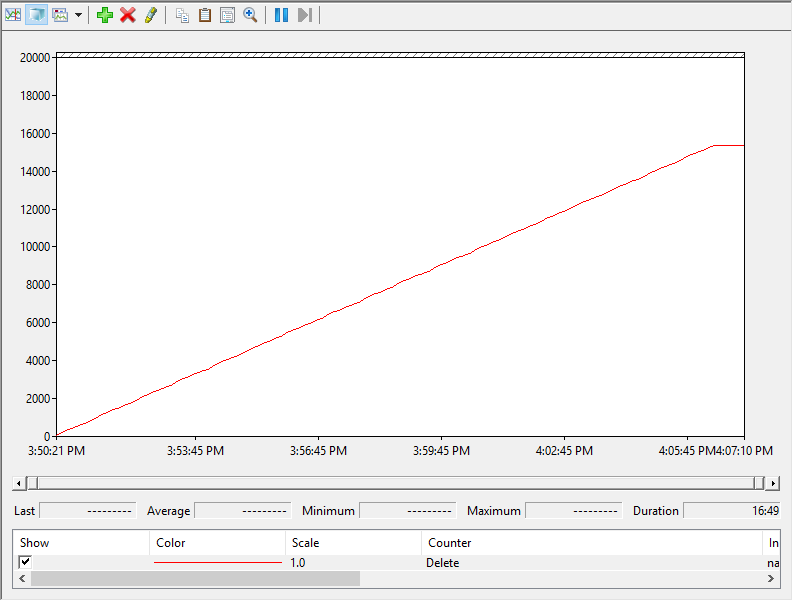
1,000 MB/s rate limit test perfmon report:
No inflection point here because the UNMAP rate is the same as the default “ramp-up” rate of 1 GB/s.
Making it faster
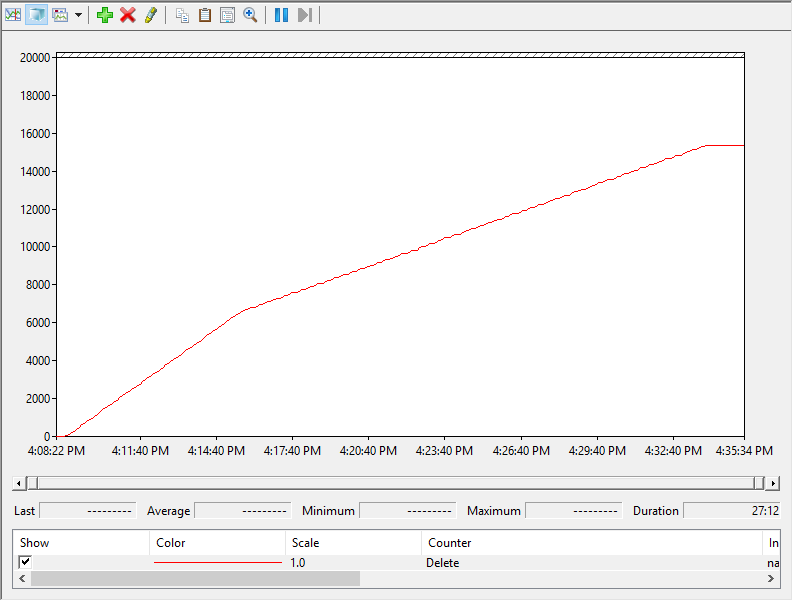
Another observation I have made is that nothing above 1,000 MB/s seems to work–it never really seems to go faster than that.
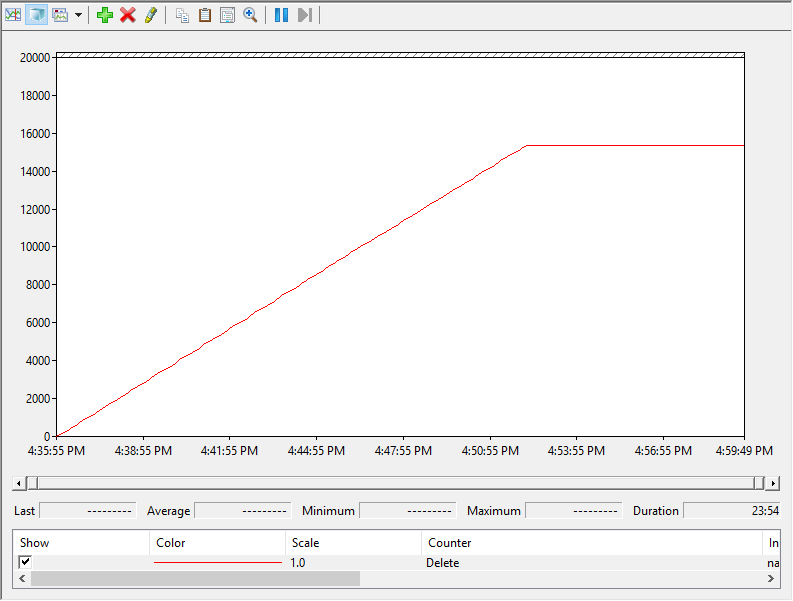
Here is a perfmon print out of the esxtop-tracked UNMAP I/Os being issued:
It has a constant slope of 1 GB/s of UNMAP. It never reaches the configured 2 GB/s.
There are five possibilities for why this is so (that I can think of):
- Some kind of bug in ESXi.
- ESXi simply cannot send any more UNMAPs and it just maxes out at 1 GB/s.
- In order to push that much UNMAP you must have more than one ESXi host participating. This might explain the why it always starts out at 1 GB/s–ESXi first puts no limit, so it maxes out what the single host can do (which is for some reason 1 GB/s) and then throttling kicks in to what it is set to.
- The array has an issue. ESXi supports up to 100 logical block descriptors per UNMAP SCSI command, the FlashArray only supports 1. So this causes ESXi to have to send more UNMAPs (one logical block descriptor per UNMAP ). If ESXi needs to use more than one LBD per UNMAP to get past 1 GB/s this could be the reason.
- I am totally missing something.
My money is on 3. Though it could conceivably be a mix of 3 and 4 (and 5). Let’s find out.
Multi-Host Reclamation
VMFS-6 automatic reclamation is based on a crawler that runs on all hosts that monitors dead space build up of all VMFS-6 hosts that they are “using” (running VMs on). So this is designed to be a shared process by many hosts–in other words: distributed automatic UNMAP. Share the load.
The above investigations were lab exercises to see how UNMAP behaves, but likely in your environment this process will be shared across many hosts. Let’s see how this behaves.
I will first run a test with my 500 MB/s datastore with two hosts “Active” against it (they both have running VMs on it). Here are the perfmon print outs of the running UNMAP I/O totals from both hosts.
Here is my result from my datastore with the rate limit set to 2,000 MB/s being reclaimed by two hosts:
Three things to note here:
- The reclamation finished twice as fast for both. When I reclaimed the same amount of space with the 500 MB/s limit with one host it took a bit under 30 minutes. With two hosts it took about 13. The 2000 MB/s test also finished twice as fast since both hosts were issuing UNMAP.
- The hosts unmapping the 500 MB/s datastore still ran at 500 MB/s each when limits kicked in–they did not equally share in the limit. Same thing for the 2,000 MB/s (except once again it was still only doing 1,000–doesnt seem to be able to do more) So this means the rate limits are PER HOST, PER DATASTORE.
- The rate limit kicked in at 200 GB reclaimed instead of 400 GB. So when each host reclaimed 200 GB their limit kicked in (400 GB in aggregate). So the inflection point doesn’t seem to be host specific–it seems to be tracked at the datastore level.
So this is interesting. I am still not sold that the magic spot where limits kick in is 400 GB. Since all of the datastore I was testing happened to be 4 TB in size I wondered if the magic number was 10% of the volume size? I ran another test with a 8 TB volume and 400 GB was still the inflection point. So it doesn’t seem to be related to datastore size.
So my questions for VMware:
- Does the 1 GB/s limit have to do with array support of logical block descriptors per UNMAP SCSI command? How can 2,000 MB/s be achieved?
- Is 400 GB the magic limit for rates to be enforced or is it something else?
- Why doesn’t the rate limit just kick in immediately?
- The things I found listed in the TL;DR section, are they correct?
- Why doesn’t this ever kick in if the virtual disks deleted are all thick?
I’ll reach out to them to find out.
Conclusions
In the end, my best practice recommendation (for Pure) is likely to keep it at the default. The space will eventually be reclaimed. Why change something if you dont really need to? And unless you are deleting a lot of space at once, the limit doesn’t really even come into play. If you really want the reclamation to always be faster then yeah go ahead and increase it. But in general, the default is probably fine for most. Furthermore, most datastores will be actively used by many hosts, so with all of the UNMAP coming from each host, even though it is only 25 MB/s, it will add up.
Hi Cody,
Thank you very much for your posting!
1. if set a high unmap rate on ESXI, any performance impact on Pure storage?
2. VM1 on host1&datastore1, host1&host2 share datastore1, if delete VM1, will host1&host2 issue unmap simultaneously? If yes, how do these hosts coordinate with each other?
3. In your multi-host testing, if UNMAP rate setting different on hosts, will the UNMAP rate work as expected on each host?
Thank you very much!
You’re welcome!
Q1: Not in normal circumstances. It is a very lightweight operation for us so there is little danger in doing this. Though in situations where a FA is very heavily loaded (performance wise) a sudden heavy deallocation operation from a lot of hosts could be problematic. Though this is rare.
Q2: Hosts seem to only UNMAP the VMs that were deleted from themselves. So they don’t really coordinate.
Q3: You set the rate on the datastore, not the host, so all hosts would run the same rate for a given datastore.
Until I hear confirmation from VMware this is simply all my observation–I don’t know much of this factually yet.
Does UNMAP work with FreeNAS?
Datastore level UNMAP isn’t necessary on NFS (since the storage controls the file system). In guest UNMAP though matters. I dont know specifically about that system, but as long as it supports thin VMDKs and RPC TRUNCATE in guest reclamation should work
Is the fixed option still an async proces we will have to wait for 24 hours, or will it kick in immediately ?
I don’t believe any setting will change the aggressiveness of unmap as far as timing goes (just when it does start you can make it happen faster). Though normally you shouldn’t have to wait the full 24 hours, it just if the datastore is idle it can take up to that time to reclaim.
Is automatic space reclamation by VMware impacted when installing the new PureStorage HTML5 vCenter plugin ? In the vCenter datastore view, you can Run Space Reclamation or schedule Space Reclamation.
No. All that does is allow you to run a manual one-off operation or a recurring schedule. Running it manually will just make the automatic UNMAP less useful (likely wont be much for it to UNMAP if the manual process already ran)