
So I am in the middle of updating my best practices guide for vSphere on FlashArray and one of the topics I am looking into providing better guidance around is ESXi queue management. This breaks down to a few things:
- Array volume queue depth limit
- Datastore queue depth limit
- Virtual Machine vSCSI Adapter queue depth limit
- Virtual Disk queue depth limit
I have had more than a few questions lately about handling this–either just general queries or performance escalations. And generally from what I have found it comes down to fundamental understanding of how ESXi queuing works. And how the FlashArray plays with it. So I put a blog post together of a use case and walking through solving a performance problem. Explaining concepts along the way.
Please note:
- This is a simple example to explain how queuing works in ESXi
- Mileage will vary depending on your workload and configuration
- This workload is targeted specifically to make relationships easier to understand
- PLEASE do not make changes in your environment at least until you read my conclusion at the end. And frankly not without direct guidance from VMware support.
I am sorry, this is a long one. But hopefully informative!
If you prefer a video, here is my 1 hr VMworld session that goes into depth on what I write below:
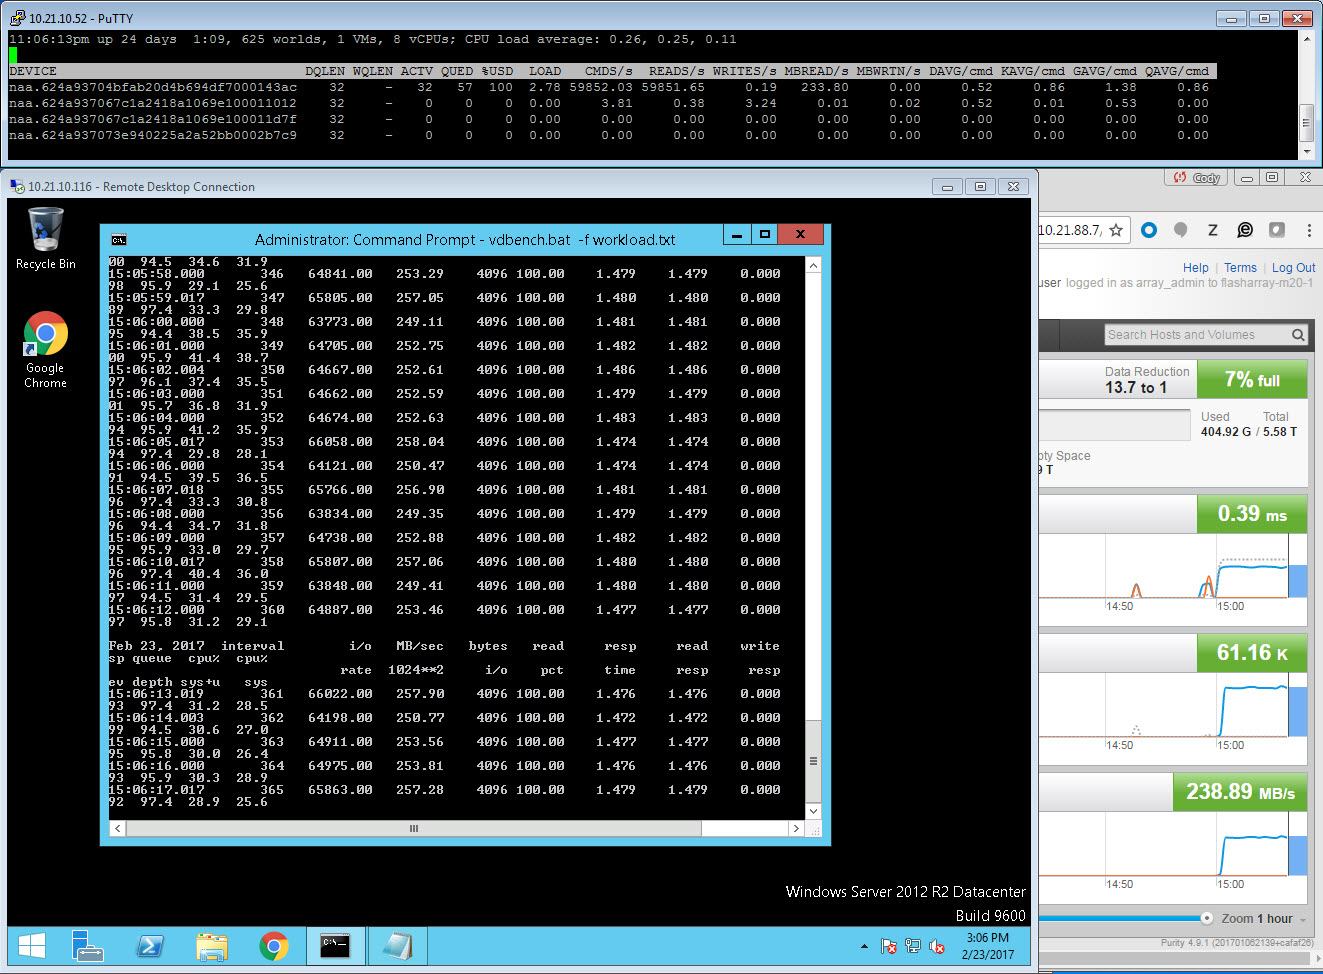
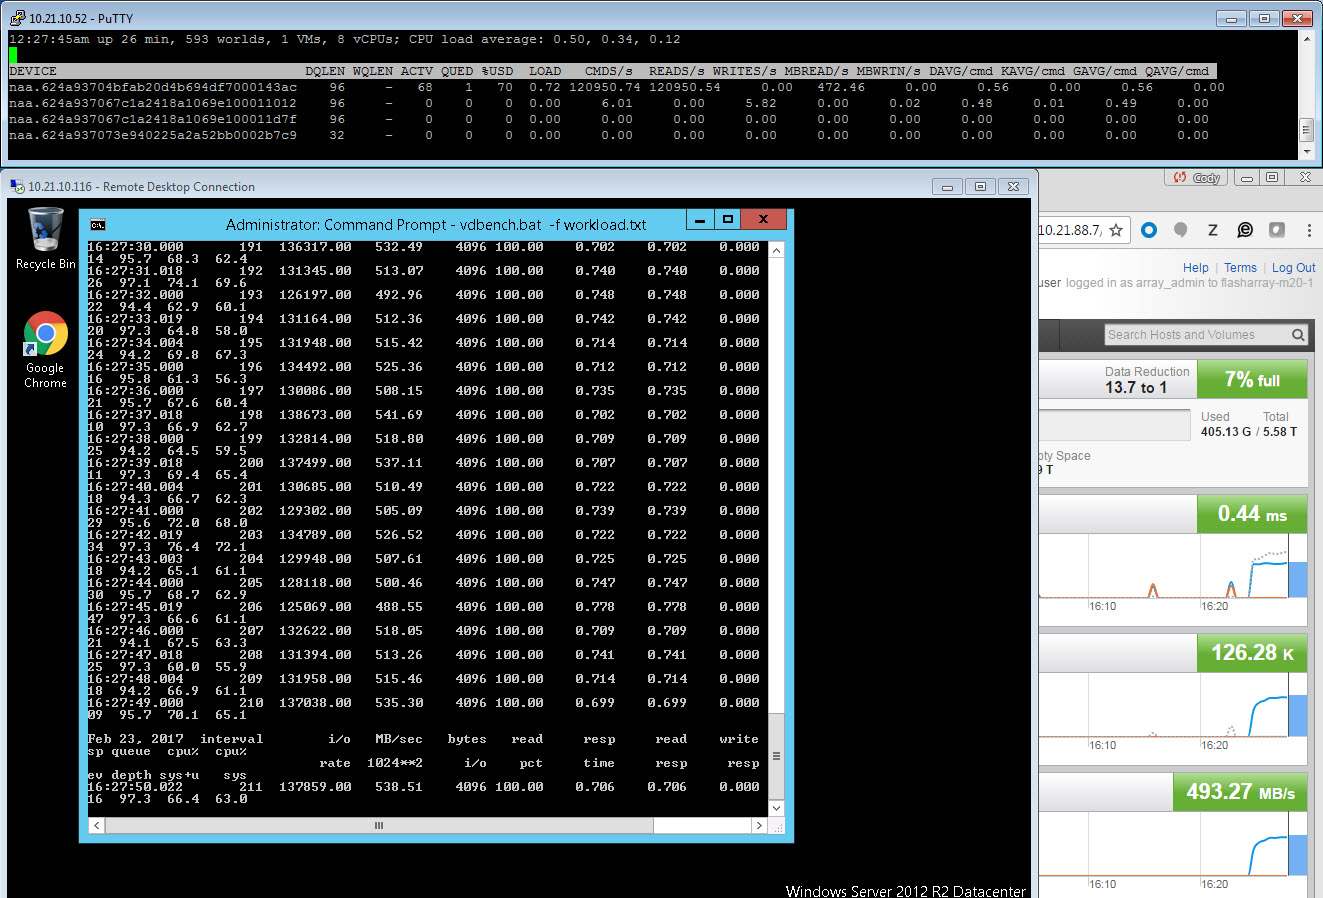
One thing to note here, this is one virtual machine running workload to a virtual disk on one VMFS. So nothing is interfering, so while this is not realistic, I think it is still valuable to explain how these things work. So here is the screenshot:
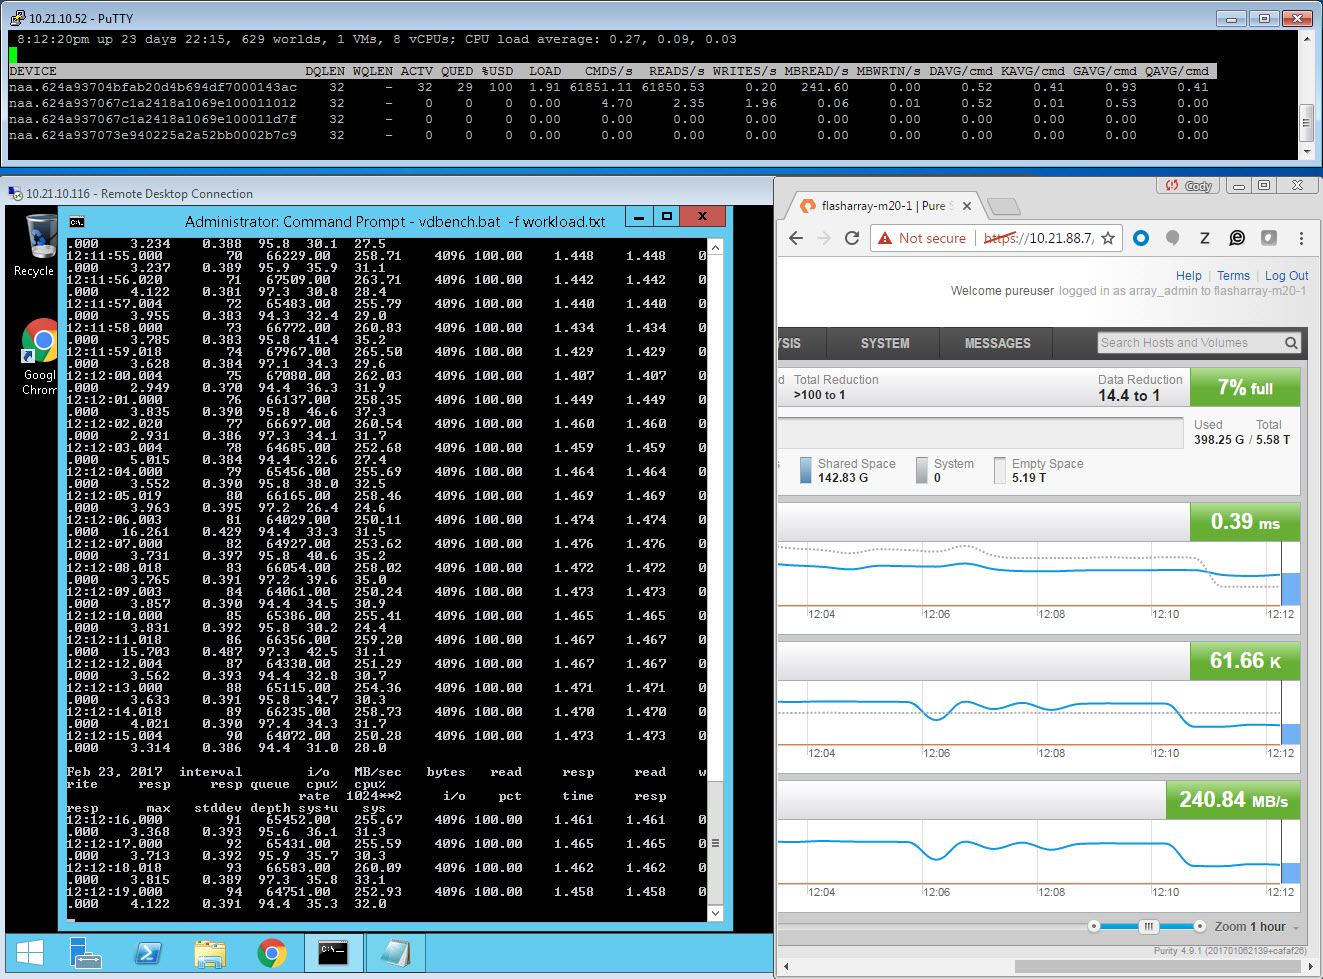
There is A LOT of information here and it pretty much tells you everything you need to know to solve the problem. The problem here is as such:
“Hi I am Mrs. Customer and the latency in my virtual machine is high and my IOPS is not as high as I want it to be. It was much better on my equivalent physical server. Furthermore, the latency on the FlashArray is reported as low. Is your array lying? Why is my VM latency high? What can I do (if anything) to fix it?
Quick answer: No. Let me explain. Yes!
So then, let me explain.
For those curious, my virtual machine is configured as such:
- Windows 2012 R2
- 8 CPUs, 2 cores per socket
- 32 GB of memory
- ESXi 6.5, Virtual Hardware Version 13
- EagerZeroedThick virtual disk (1 TB)
- VMFS-6
- Cisco UCS B-B200-M3
- Intel(R) Xeon(R) CPU E5-2680 0 @ 2.70GHz
- VDBench 50406 for I/O Workload
- Paravirtual SCSI Adapter, default settings
- Workload virtual disk is on a different VMFS than the boot virtual disk of the VM
The workload is configured to run 130,000 4K Read IOPS with 96 outstanding I/Os (threads). But we are not getting 130,000. Let’s find out why!
Breaking it down
Let us break this down. First let’s look at the virtual machine portion of the screen shot.
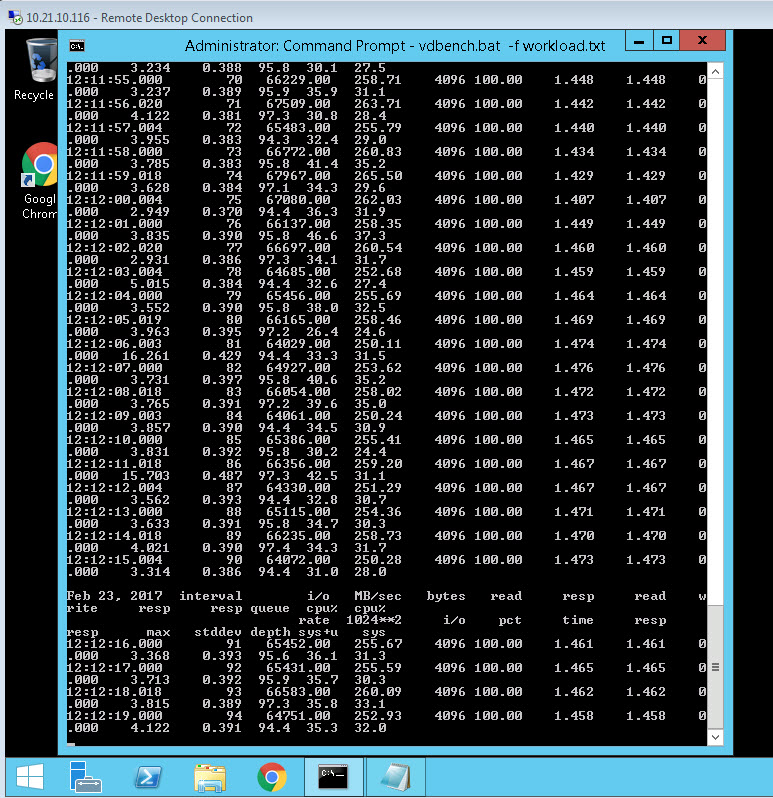
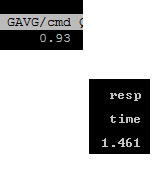
We see a few things here. One is, sure enough the latency is relatively high: 1.4 ms (which is high for an AFA), especially just 4 KB reads. Also from the VDBench printout, the active queue depth in the VM for that virtual disk is 96, which makes sense as my VDBench workload is configured to use 96 threads. It is pushing about 65,000 IOPS. But the workload is actually configured to push 130,000 IOPS, but for some reason it cannot. So, well, it must be the storage! Let’s look at the FlashArray:
Whoa! The FlashArray is reporting sub-millisecond latency! It MUST be lying! Not so, actually.
The FlashArray doesn’t know about how long an original request takes inside of ESXi, like queueing in the guest or kernel, so if you see good latency on the FlashArray and bad latency in the VM, there must be a bottleneck in the ESXi host. More on what we report as our latency in a bit.
Also, let’s assume memory and CPU is not in contention.
So now we dig into ESXi. A good way to do this is esxtop. SSH into ESXi and run esxtop.
I have one instance of esxtop running in this screenshot.
This shows my physical device statistics (you can configure what it shows). The throughput and IOPS reported here (MBREAD/s and CMD/s respectively) are the same as the FlashArray.
Understanding Latency Metrics
What about latency? There are a few other important numbers here that are important to understand:
- DAVG–this is the time (ms) seen from the ESXi host once it sends the I/O out of the HBA until it is acknowledged back. So this includes SAN transit and storage array processing.
- KAVG–this is the time (ms) the I/O spends in the ESXi kernel. This is usually zero, if it is not, you are overwhelming the device queue and then queuing inside of ESXi.
- GAVG–this is the full time (ms) the guest sees from the I/O it sends. Basically DAVG + KAVG.
First, our DAVG is higher than our FlashArray latency.
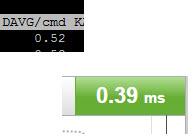
Why is that? Well, you need to understand how we calculate our latency and how ESXi calculates DAVG. The changes depending on a write or a read.
A write:
- ESXi submits the write request to the array. DAVG latency times starts.
- When the FlashArray gets a write request, now the FlashArray latency timer starts.
- The FlashArray allocates a buffer and we tell the host we are ready. This is a one-way trip back to the host. This is counted.
- The host sends the actual data to fill the buffer. This is another one-way trip across the SAN which is also included.
- The FlashArray then sends out the write acknowledgement. As soon as this leaves the FlashArray, the FlashArray latency timers stops.
- There is one more one-way SAN transit and then ESXi host receives the acknowledgement and the DAVG timer stops.
A read:
- ESXi submits the read request to the array. DAVG latency times starts.
- When the FlashArray gets a read request, now the FlashArray latency timer starts.
- The FlashArray allocates a read buffer and returns the data out, the FlashArray latency timers stops.
- The host receives the actual data to fill the buffer. This is another one-way trip across the SAN which is also included and the DAVG timer stops.
So in both situations, DAVG has one more round trip then us. But since DAVG contains two round trips for a write and only one for a read, the difference is (under normal circumstances) relatively bigger for reads as compared to writes, but identical in actual magnitude as compared to writes.
Understanding Queue metrics
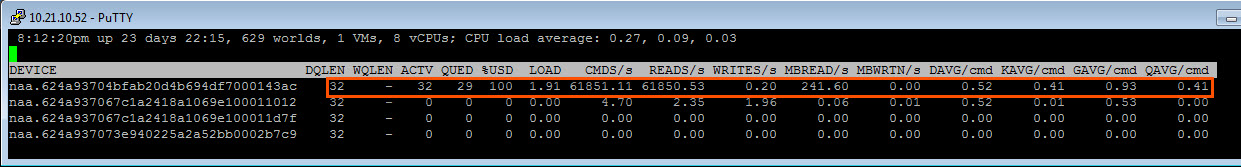
You can get A LOT more information from that esxtop screenshot. The device in question is the one with the NAA ending in “ac”. There are three other really important values here besides the previous ones. Let’s define them first.
![]()
- DQLEN–this is the configured queue depth limit for the datastore. This value is identified by looking at the configured HBA queue depth limit, which is generally 32 (QLogic FC is the exception at 64, or Software iSCSI which is 128). If there is more than one VM on the datastore then this value is the minimum of the HBA device queue depth OR the Disk.SchedNumReqOutstanding (which is a per-device setting, which defaults to 32). Whichever is smaller.
- ACTV–this is the number of slots currently in use by the workload going to the datastore. This value will never exceed DQLEN
- QUED–this value is populated if the workload exceeds what DQLEN allows. If ACTV = DQLEN, anything over and beyond that will be queued to wait to be sent to the device. This shows how many I/Os are currently waiting to be sent. When this value is above zero, you are going to start seeing latency in the guest. This latency will not be reflected on the FlashArray! The timer for latency on the FlashArray starts as soon as it is submitted, so in other words, the timer on the FlashArray starts when the I/O enters the ACTV state. If you see latency difference between the array and in ESXi, it is usually because I/Os are building in QUED. If there is a no difference between the ESXi latency and the FlashArray, but a difference between those two and the virtual machine, you are queuing in the virtual machine.
So knowing this, what does this esxtop screenshot tell us?
First, my DQLEN is 32 and I only have one VM running. So this means a few things:
- Since I only have one VM sending I/O to my datastore, DSNRO is not in play.
- Since DSNRO is not in play, this means the DQLEN value is derived from the HBA device queue limit, which must be 32. Since QLogic and iSCSI default to other numbers, it is probably something else (unless someone lowered them from defaults.) In my case it is the Cisco HBA vNIC which indeed defaults to 32.
So my device queue depth for this datastore must be 32. You can confirm this by running the following command:
esxcli storage core device list --device naa.624a93704bfab20d4b694df7000143ac
Of course replace my NAA with yours.
You will see two values of importance:
Device Max Queue Depth: 32 No of outstanding IOs with competing worlds: 32
The one we are looking for is “Device Max Queue Depth”. Which is 32. The second, “No of outstanding IOs with competing worlds” actually refers to DSNRO. Which, in this case, is irrelevant as stated before. But also happens to be 32.
So we know the the workload is using 96 threads, which relates to a virtual disk queue depth of 96. Which is three times what the device can handle.
![]()
We can confirm this by looking at ACTV. ACTV reports at 32, so our device queue depth is currently full. Furthermore, we can look at QUED. This is currently 29, but if you watch it live it goes up and down between that and 32 (due to sampling differences and no workload is perfectly constant some numbers are a little off here and there). Basically we have up to 32 I/Os always waiting to be sent.
So we have at least one bottleneck. Since we have a non-zero KAVG and a non-zero QUED, our device queue depth is too low. More I/Os are being issued than what the device is configured to handle at once.
Paravirtual SCSI Queue
We also can tell from this what virtual SCSI adapter is in use. Only the Paravirtual SCSI adapter allows a per-virtual disk queue of higher than 32–PVSCSI starts at 64 and can be increased to 256 per-virtual disk. Up to 64 I/Os are getting out at once as shown by adding the ACTV and QUED values so we are at least using PVSCSI configured at least the defaults. So we aren’t using LSI Logic or something like that.
Our workload is configured to run 96 outstanding IO/s leading to a queue depth of 96. But the PVSCSI adapter is only configured by default to allow 64, so the rest queues in the VM. Therefore, the maximum ESXi sees as queued (in QUED) outside of the VM is 32. An additional up to 32 I/Os queue in the guest. This is why we have a lower latency in GAVG than what the VM actually sees. In this case ESXi is adding some of the latency by forcing some queuing and also the PVSCSI adapter is adding some latency before that by forcing some I/O to queue before it gets to ESXi.
You can check the PVSCSI virtual disk queue setting by looking at this KB article:
https://kb.vmware.com/kb/2053145
So we have two bottlenecks:
- The physical device queue is too low on the ESXi host
- The PVSCSI virtual disk queue is too low in the VM.
Changing PVSCSI Virtual Disk Queue Depth Limits
Changing one without the other will basically do nothing to help you. Both need to be changed. So, let’s change the PVSCSI setting first and confirm that. Then we will change the device queue depth limit.
As can be seen in the previous link, for Windows, the PVSCSI virtual disk queue depth limit can be changed via a registry change:
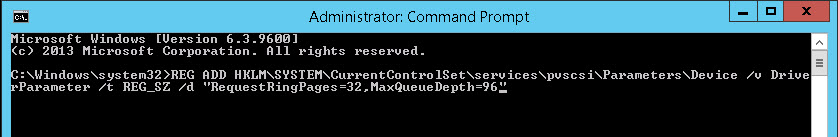
I am setting my depth to 96, because that is all I need. Though it can be increased to a maximum of 256.
So let’s restart our workload. Here is the result:
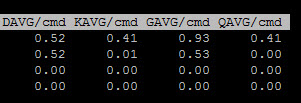
You will notice the IOPS and throughput are unchanged. The latency reported in guest has not changed. The only things that have changed are the esxtop numbers. Let’s compare the two:
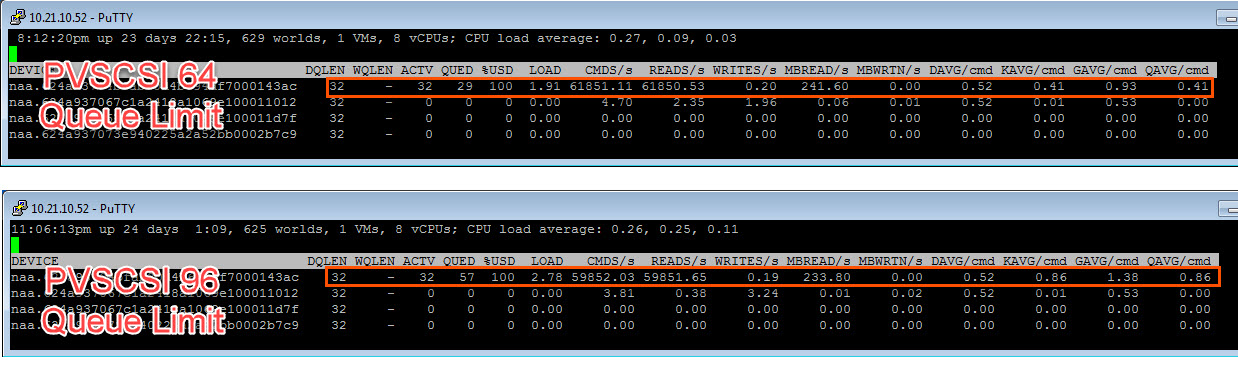
A few differences:
- The QUED is higher. The I/Os are no longer queuing in the guest but instead in ESXi.
- KAVG is higher. Since the ESXi is queuing more I/Os they spend more time in the kernel and therefore the latency is higher
- GAVG is now equal to what the VM sees. This is because ESXi now knows the I/Os are queuing.
Basically no performance benefit was achieved. We just moved the queuing down the stack. Instead of the VM queuing I/Os and then ESXi is queuing I/Os like before, the VM is immediately sending everything and now ESXi is the only one queuing. In other words, earlier before changing PVSCSI, all I/Os queued in the VM for .4 ms and then queued in ESXi for .4 ms. Now the VM queue is zero and all of the I/Os queue in ESXi for .8 ms as can be seen in KAVG.
Changing the ESXi HBA Physical Device Queue Depth Limit
Now let’s fix the device queue limit problem.
Our device limit is currently 32 (as is seen by DQLEN). So we need to increase it. Changing this value changes a bit depending on the HBA you are using. The value names differ depending on you vendor or what you are using:
| Type | Default Value | Value Name |
| QLogic | 64 | qlfxmaxqdepth |
| Brocade | 32 | bfa_lun_queue_depth |
| Emulex | 32 | lpfc0_lun_queue_depth |
| Cisco UCS | 32 | fnic_max_qdepth |
| Software iSCSI | 128 | iscsivmk_LunQDepth |
Refer to your vendor documentation for exact recommendations on managing this. Some documentation can be found here:
Note that the command(s) varies between ESXi versions.
I am using Cisco UCS, so I need to change my fnic_max_qdepth value.
You can do this with esxcli in the shell, or use PowerCLI, which is my preference:
connect-viserver -Server 10.21.10.53
$esxi = get-vmhost
$esxcli = $esxi| get-esxcli -v2
$args1 = $esxcli.system.module.parameters.set.createArgs()
$args1.parameterstring = "fnic_max_qdepth=96"
$args1.module = "fnic"
$esxcli.system.module.parameters.set.invoke($args1)
This will change the value to 96–the highest value is up to the vendor, but the max is usually 256. You can verify the value using a similar process:
$args2 = $esxcli.system.module.parameters.list.createargs()
$args2.module =  "fnic"
$esxcli.system.module.parameters.list.invoke($args2)
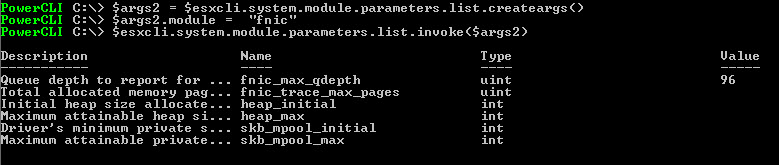
Note, if you have not set the value yet, it will report as empty (null). Now reboot the ESXi server.
So, technically I only have to raise this to 96. But in general, if you think you might ever need to raise this, I would just raise it to 256 (the max) instead of some other value. The reason for this, is that in general, most datastores have more than one VM. So DSNRO will come into play. DSNRO is 32 and will override a higher device queue depth anyways. DSNRO is also able to be changed online. So I can set my device queue depth to the maximum and reboot once. Then control my actual DQLEN via changing DSNRO, which I can change on the fly. But for demonstration purposes, I will stick with 96.
Okay, so now my host is back online. We can verify the change. If we run esxcli storage core device list again we can see:
Device Max Queue Depth: 96
No of outstanding IOs with competing worlds: 32
So our device max queue depth is now 96. We can also see in esxtop under DQLEN that it is increased too.
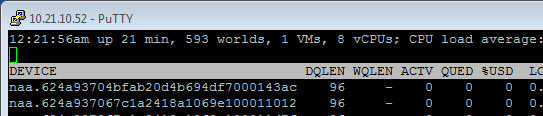
DSNRO is still at 32. But since there is just one VM, it doesn’t matter. If there was more than one running VM on this datastore, the DQLEN value would be 32 still. So you would need to increase DSNRO to 96 as well. But as I said, not needed in this case.
So let’s run the workload!
You will note quite a lot!
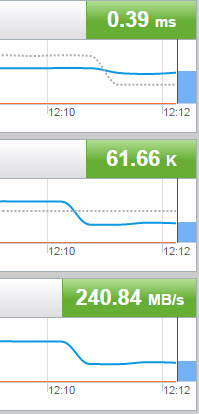
The in-guest latency drops from 1.4 ms down to .7 ms:
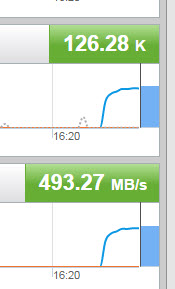
The IOPS and throughput has gone UP (more than doubled) to 125,000 IOPS and almost 500 MB/s.
QUED and KAVG is down to zero, so no queuing:
![]()
You might note that the latency in-guest is still a bit higher than DAVG, even though there is no queuing. This usually means there is an inefficiency in your app. Maybe TOO many threads etc. But figuring that out is beyond this conversation.
Conclusion
A quick thing to note, is that the nice thing about the FlashArray is that it handles what is thrown at it. The troubleshooting and configuring is in the ESXi layer–which is where you should be spending your time. So the metrics you need, and the knobs you must turn are all in ESXi and the VM. Makes it easy.
Furthermore, this workload was tailored a little to make a point. So just changing your queue may not give you a dramatic improvement like this. But, in the end, if you want to push a lot of I/O to a single virtual disk on a single datastore, this will be required.
But more importantly…

…should I change these values? In general, I recommend not to. The majority of environments do not need to do this.
There are recommendations out there to do this, especially for AFAs. But I do not agree with this default recommendation. Mostly for three reasons.
- Reason number one is that ESXi is designed out of the box for fairness, not absolute performance. From a storage perspective, it is throttled on many layers, in order to stop one VM from overtaking other VMs on that datastore, and one datastore from overtaking other datastores on that HBA, and a given ESXi host from overtaking other ESXi hosts (or otherwise) on an array. Messing with these values messes with this fairness and can cause interference with other objects, if something goes out of control. Plus changing default values always makes environments harder to support, you change it one place, make sure you change it everywhere in the cluster etc.
- Reason number two is that is just simply isn’t usually needed. Most workloads are distributed across hosts and/or VM and/or datastores. Therefore, the needs to up these values does not generally exist.
- Reason number 3, I think that vendor recommendations out there for AFAs with ESXi to increase these values by default was somewhat due to PoC “vanity” and not real-world situations. Pure made these recommendations in the early days too which I reversed about two years ago. Back in the day, early AFA PoCs were performance-based typically and these PoCs only had a few hosts deployed in them. The only way to really performance test an AFA from a small number of hosts? Open up those queues!
In the end, increasing these values can do you more harm than good in many (most?) situations. There is plenty of reading out there in the internet as to why opening up queues can be bad. I won’t go into it, as this post is long enough.
There are other options too. Use more virtual disks. Use multiple PVSCSI adapters. Multiple datastores. Etc. Understand your application and choose accordingly.
I recommend changing these values only if you know your workload needs it. High-performance density from one VM to one datastore is a common use case and indeed is what I described here.
If you do change these values, do so with discretion and planning. Maybe a high-performance cluster etc. Do you need the queues changed everywhere in the stack? Etc. Furthermore, I recommend using vSphere QoS if you do as well. This will reduce or eliminate the noisy neighbor problem. In vSphere 6.5, things like IOPS limits can be applied via policy which makes it easy even at scale to do.
In the end, I hope this post at least explains how things work. Please also note that the world becomes much less straight forward as you add and share more VMs, across more datastores, more hosts, with different workloads etc. All of the more reason to hold back on changes. But if you do have performance problems, hopefully this gives you the base understanding so you know where to start troubleshooting.
This is a great write up and extremely informative. Thanks!
Thank you!!
Great document and well explained
Thank you!
Great article!
Thanks a lot!
Cody, did you change the I/O Throttle Count value at the vHBA level within the UCS at all?
I didn’t, but if I wanted to push any more workload I would have to. That is the next bottleneck I’d because the default I believe is 256.
Gotcha. That seems to be the one recommendation I see out there at the HBA level that’s outside of ESXi when it comes to AFA. Awesome post.
Thank you! Yeah generally you are going to want to increase this if you increase the device queue depth, because UCS HBA limit is lower than most vendors, otherwise a single device can overwhelm the HBA limit.
For a Physical Mode RDM, which takes precedence? Device Max Queue Depth or DSNRO?
The same rule applies. If a RDM is in use by only one VM it uses HBA device queue depth, if two VMs are using that RDM it uses the minimum of that and DSNRO
Great article, thanks for taking the time to write this.
You’re welcome! Thank you!
Great Article!
Thank you!
Great article! How do I know if we should increase the queues? My customer is running heavy SQL servers with 24 vCPU, 320 GB ram. In the pure dashboard I can see from time to time “Avg IO size 106.39K”. Is that indicating we should look in to increasing the queues?
Jens,
Thank you! Average I/O size doesn’t really have a bearing on queue depth. The only real indicator for a need to increase the queue depths is latency, and that is latency seen from the guest. If the guest is experiencing high latency and the FlashArray reports the latency as low, meaning GAVG is high, increasing the queue depth limit is probably the solution. As long as they are happy with their latency they do not need to increase the queue depth
Cody
Depending on database workload, can get “low” latency but also low bytes/sec throughput. For example, a database backup at 64kb transfer rather than 512kb transfer(usually these backups are most optimal at 1mb or greater but pvscsi allows at most 512kb transfer). If 64kb transfer is needed for such a backup, may need to increase outstanding IO for the backup operation (SQL Server backup buffercount, usually) and verify that queue depth of virtual disks, pvscsi, fNIC if applicable, and ESXi LUNs all support the increased OIOs.
Spill of sort/hash to tempdb, and aggressive readahead are the other two contexts to watch queue length vs queue depth closely in Windows guest for SQL Server host, even when average latency seems low enough to be acceptable.
What an excellent piece of material I have just read. Worth spending all the time to expand the images and to go through each and every detail mentioned in the article. I feel that I am better at troubleshooting “storage “related issues in our environment now. Thanks heaps for sharing that! PS.: I came to this link from the Best Practices document for vSphere, which is yet another great work of yours. Very well explained and full of additional information not usually found on other vendors documentation. Well done!
Thank you so much for the kind feedback! Glad both this article and my white paper were helpful!
Very helpful info. Thanks.
Was your VDBench config anything like this?
sd=sd1,lun=[drive]:\iobw.tst,threads=96,size=100m
wd=wd*,sd=*,xfersize=4k,rdpct=100,seekpct=0,openflags=directio
rd=run1,wd=wd*,iorate=max,elapsed=300,interval=10
hi cody, can you please share vour VDBench config that you have used in this article? would be great, thank, sebastian
Great article very helpful. Very good work.
Impressive article and very well written.
Thank you!
Would this be a potential issue if someone had a 4TB datatstore with 40+ VMs on that datastore?
Billy,
Depends on a lot of things. But it really doesn’t have much to do with the VM count or datastore size, just the overall workload and how many ESXi hosts that workload is spread across on. And of course what the underlying array can offer from a performance perspective. I would recommend just looking at the KAVG stats on your ESXi hosts. If that number is anything but zero you likely have a problem.
Cody
This is an excellent write up!!
Great post, but I have one question. Would you be better served turning on Adaptive Queue Depth Throttling instead of changing the HBA queue depth?
Thank you! Possibly. But there are two things to consider. Adaptive Queue Depth only changes DSRNO–so you would still need to set it at a higher level first. Which isn’t a big deal of course. The more important thing is does the underlying array support AQD. Some do, some don’t. If they never report queue full back to VMware AQD won’t kick in. If it is an option for you, it is certainly worth considering.
Thank you for this awesome article.
It would be good to explain how Storage IO Control comes into play. It disables DSRNO and manages queue depth dynamically until DQLEN of the LUN. Thus it may be advisable to increase DQLEN to the max and let SIOC do its job.
You’re welcome and thank you!
Yeah for sure–SIOC, SDRS, Dynamic Queue Depth throttling. These all come into play, or at least can. I plan to do some more posts around this soon, so I will see when I can hit on that.
Though it depends on the underlying storage. If you have an AFA, it would take a tremendous workload to get the latency to a point where SIOC would actually kick in. In this scenario, I am not sure I would go the SIOC route–it might be more useful to use vSphere VM IOPS limits or array based QoS. But regardless it would make a good topic of a blog post.
Hi Cody,
Great article! I am actually interested in your opinion on something I read in the Pure VMware Best Practices document, which is: since flasharrays internally are not limited by individual device queues, there is no benefit to provisioning more than one volume for an entire VMware environment, which mean 1 datastore. Is this true considering the queuing that takes place per device within ESX ? I think that is a very important design consideration and would like to know your perspective.
Thank you! This is true from a FlashArray perspective–though yeah absolutely ESXi has it’s own concurrency limits. So the main point is FlashArray volume count isnt really the main limit here–it is ESXi. Do you plan on pushing a lot of I/O from a single host to a single datastore? Then you need to increase your queue depths in ESXi. Yes, you can parallelize datastores will also offer you more performance, but if the workload that you need to push goes to a single VMDK, doing that doesn’t help as a VMDK can only be on one datastore. So increasing queue depths doesn’t really help. If the workload is spread across VMDKs (or VMs) then yeah you have three options: increase the queue depth, spread the VMs across hosts on the same datastores, or spread the VM across different datastores (or combinations of the three). The main point is that it is really an ESXi design decision–not a FlashArray one.
Great write up! Almost solved all the puzzles in my mind.
I wonder whether this process also applies to performance troubleshooting when RAID controller is involved(like in a vSAN environment)
Thanks! This is a decent post around QD and VSAN http://www.yellow-bricks.com/2014/06/09/queue-depth-matters/ Essentially it is the same idea DSRNO and the HBA (in this case the controller) have impact on what can be done by controlled drives
Great post.
Could you please post your vdbench parameters please? Great post btw.
Thanks!! I don’t think I still have them–it has been a long time. If I remember it wasn’t particularly sophisticated as it was just a plumbing test. 32KB, 100% reads. What I fiddled with was mostly outstanding I/Os.
At last! The answer to the mystery of the Missing IOPs is Solved! Great post, I recommend DBAs read it.
Glad you found it useful!
Thank you for taking the time to write this all out. I have also gone thru many of these same tests and to be honest cringed at the thought of collecting all my information to share. In particular where you state it is a long read, I was impressed with the thoroughness in such a condensed read and all the tools shared. I have bookmarked, liked, shared, subscribed and will continue to refer to when ever this discussion come up.
You’re welcome!
Hey Cody,
Thank you for the great write up I’ve seen a 10% performance improvement across most of my environments! One problem I had was with executing the script for changing the FNIC Max Qdepth parameters just errors out with
System.Management.Automation.PSMethod does not contain method named createargs
You’re welcome! Let me take a look
Kudo’s
Not sure if you still read comments on this post but what would happen if instead of changing the queue depth on the esxi host and para scsi adapter you change the thread count to match the queue depth so set threads to 32? Would we see similar iops latency and throughout as a queue depth and thread count of 96?
Also since nvme drives don’t have a 32 command limit per lun like non-nvme drives and have a limit of 65k queues that support up to 65k commands wouldn’t removing queue depth entirely or making it closer to the limits of nvme be a better default all around?
Doing further reading I guess that is the theoretical limit of nvme and individual drives might only have 64-128 queues. What is the range of queues and commands pure supports for its architecture?
Would you please correct me about follow?
1- When GAVG is more than 0 that means, the issue can relates to scsi adapter (for example change to paravirtual . Is that correct ?
2- When KAVG is less than 0 it can relates two issue :
high cpu/memory usage on that esxi hosts
we can update HBA driver
Is that correct ?
3 – When DAVG is more than 0. It can relates to HBA card queue depth / media using from HBA card to SAN or san swicth
Is that correct ?